What Does Gyldendal A/S's (CPH:GYLD B) P/E Ratio Tell You?

Want to participate in a short research study? Help shape the future of investing tools and you could win a $250 gift card!
This article is for investors who would like to improve their understanding of price to earnings ratios (P/E ratios). We'll look at Gyldendal A/S's (CPH:GYLD B) P/E ratio and reflect on what it tells us about the company's share price. Gyldendal has a P/E ratio of 29, based on the last twelve months. That is equivalent to an earnings yield of about 3.4%.
Check out our latest analysis for Gyldendal
How Do I Calculate A Price To Earnings Ratio?
The formula for P/E is:
Price to Earnings Ratio = Price per Share ÷ Earnings per Share (EPS)
Or for Gyldendal:
P/E of 29 = DKK440 ÷ DKK15.17 (Based on the trailing twelve months to December 2018.)
Is A High P/E Ratio Good?
A higher P/E ratio implies that investors pay a higher price for the earning power of the business. That is not a good or a bad thing per se, but a high P/E does imply buyers are optimistic about the future.
How Growth Rates Impact P/E Ratios
If earnings fall then in the future the 'E' will be lower. That means unless the share price falls, the P/E will increase in a few years. So while a stock may look cheap based on past earnings, it could be expensive based on future earnings.
Gyldendal shrunk earnings per share by 55% over the last year. And over the longer term (5 years) earnings per share have decreased 16% annually. This could justify a pessimistic P/E.
Does Gyldendal Have A Relatively High Or Low P/E For Its Industry?
The P/E ratio essentially measures market expectations of a company. You can see in the image below that the average P/E (17.9) for companies in the media industry is lower than Gyldendal's P/E.
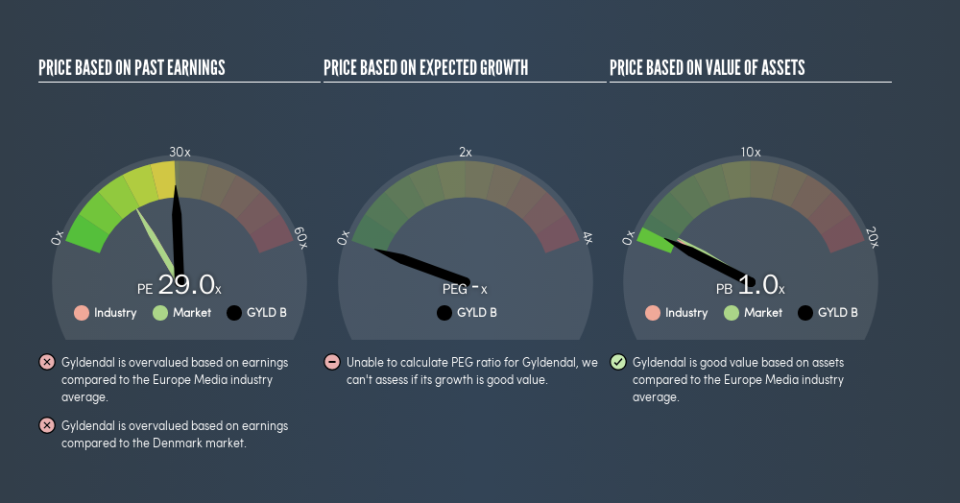
That means that the market expects Gyldendal will outperform other companies in its industry. Clearly the market expects growth, but it isn't guaranteed. So further research is always essential. I often monitor director buying and selling.
A Limitation: P/E Ratios Ignore Debt and Cash In The Bank
One drawback of using a P/E ratio is that it considers market capitalization, but not the balance sheet. Thus, the metric does not reflect cash or debt held by the company. In theory, a company can lower its future P/E ratio by using cash or debt to invest in growth.
While growth expenditure doesn't always pay off, the point is that it is a good option to have; but one that the P/E ratio ignores.
How Does Gyldendal's Debt Impact Its P/E Ratio?
Gyldendal has net cash of ø29m. That should lead to a higher P/E than if it did have debt, because its strong balance sheets gives it more options.
The Verdict On Gyldendal's P/E Ratio
Gyldendal trades on a P/E ratio of 29, which is above the DK market average of 16.9. The recent drop in earnings per share might keep value investors away, but the relatively strong balance sheet will allow the company time to invest in growth. Clearly, the high P/E indicates shareholders think it will!
Investors have an opportunity when market expectations about a stock are wrong. As value investor Benjamin Graham famously said, 'In the short run, the market is a voting machine but in the long run, it is a weighing machine.' We don't have analyst forecasts, but shareholders might want to examine this detailed historical graph of earnings, revenue and cash flow.
You might be able to find a better buy than Gyldendal. If you want a selection of possible winners, check out this free list of interesting companies that trade on a P/E below 20 (but have proven they can grow earnings).
We aim to bring you long-term focused research analysis driven by fundamental data. Note that our analysis may not factor in the latest price-sensitive company announcements or qualitative material.
If you spot an error that warrants correction, please contact the editor at editorial-team@simplywallst.com. This article by Simply Wall St is general in nature. It does not constitute a recommendation to buy or sell any stock, and does not take account of your objectives, or your financial situation. Simply Wall St has no position in the stocks mentioned. Thank you for reading.

