Does Hafary Holdings Limited (SGX:5VS) Have A Good P/E Ratio?

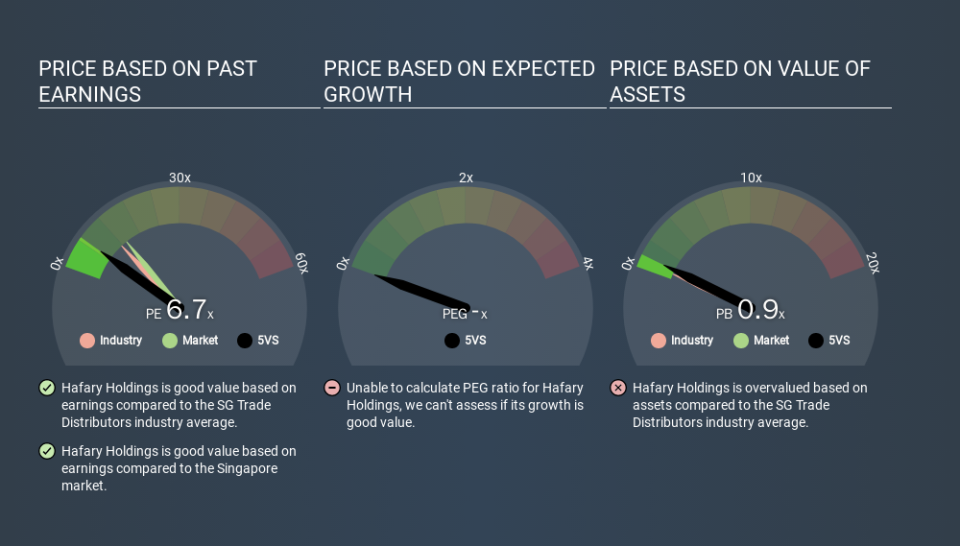
This article is written for those who want to get better at using price to earnings ratios (P/E ratios). We'll look at Hafary Holdings Limited's (SGX:5VS) P/E ratio and reflect on what it tells us about the company's share price. Hafary Holdings has a P/E ratio of 6.73, based on the last twelve months. In other words, at today's prices, investors are paying SGD6.73 for every SGD1 in prior year profit.
See our latest analysis for Hafary Holdings
How Do I Calculate A Price To Earnings Ratio?
The formula for P/E is:
Price to Earnings Ratio = Price per Share ÷ Earnings per Share (EPS)
Or for Hafary Holdings:
P/E of 6.73 = SGD0.14 ÷ SGD0.02 (Based on the year to September 2019.)
Is A High Price-to-Earnings Ratio Good?
A higher P/E ratio means that buyers have to pay a higher price for each SGD1 the company has earned over the last year. All else being equal, it's better to pay a low price -- but as Warren Buffett said, 'It's far better to buy a wonderful company at a fair price than a fair company at a wonderful price'.
Does Hafary Holdings Have A Relatively High Or Low P/E For Its Industry?
The P/E ratio indicates whether the market has higher or lower expectations of a company. The image below shows that Hafary Holdings has a lower P/E than the average (11.6) P/E for companies in the trade distributors industry.
Hafary Holdings's P/E tells us that market participants think it will not fare as well as its peers in the same industry. Since the market seems unimpressed with Hafary Holdings, it's quite possible it could surprise on the upside. If you consider the stock interesting, further research is recommended. For example, I often monitor director buying and selling.
How Growth Rates Impact P/E Ratios
Companies that shrink earnings per share quickly will rapidly decrease the 'E' in the equation. That means unless the share price falls, the P/E will increase in a few years. Then, a higher P/E might scare off shareholders, pushing the share price down.
Hafary Holdings's earnings per share fell by 13% in the last twelve months. And over the longer term (3 years) earnings per share have decreased 7.6% annually. This growth rate might warrant a low P/E ratio.
Remember: P/E Ratios Don't Consider The Balance Sheet
One drawback of using a P/E ratio is that it considers market capitalization, but not the balance sheet. That means it doesn't take debt or cash into account. In theory, a company can lower its future P/E ratio by using cash or debt to invest in growth.
Such expenditure might be good or bad, in the long term, but the point here is that the balance sheet is not reflected by this ratio.
How Does Hafary Holdings's Debt Impact Its P/E Ratio?
Hafary Holdings's net debt is considerable, at 214% of its market cap. This level of debt justifies a relatively low P/E, so remain cognizant of the debt, if you're comparing it to other stocks.
The Verdict On Hafary Holdings's P/E Ratio
Hafary Holdings has a P/E of 6.7. That's below the average in the SG market, which is 13.5. The P/E reflects market pessimism that probably arises from the lack of recent EPS growth, paired with significant leverage.
Investors have an opportunity when market expectations about a stock are wrong. If it is underestimating a company, investors can make money by buying and holding the shares until the market corrects itself. We don't have analyst forecasts, but shareholders might want to examine this detailed historical graph of earnings, revenue and cash flow.
But note: Hafary Holdings may not be the best stock to buy. So take a peek at this free list of interesting companies with strong recent earnings growth (and a P/E ratio below 20).
If you spot an error that warrants correction, please contact the editor at editorial-team@simplywallst.com. This article by Simply Wall St is general in nature. It does not constitute a recommendation to buy or sell any stock, and does not take account of your objectives, or your financial situation. Simply Wall St has no position in the stocks mentioned.
We aim to bring you long-term focused research analysis driven by fundamental data. Note that our analysis may not factor in the latest price-sensitive company announcements or qualitative material. Thank you for reading.
