Does Haw Par Corporation Limited's (SGX:H02) P/E Ratio Signal A Buying Opportunity?

The goal of this article is to teach you how to use price to earnings ratios (P/E ratios). We'll look at Haw Par Corporation Limited's (SGX:H02) P/E ratio and reflect on what it tells us about the company's share price. Haw Par has a P/E ratio of 14.79, based on the last twelve months. That corresponds to an earnings yield of approximately 6.8%.
View our latest analysis for Haw Par
How Do You Calculate A P/E Ratio?
The formula for P/E is:
Price to Earnings Ratio = Share Price ÷ Earnings per Share (EPS)
Or for Haw Par:
P/E of 14.79 = SGD12.70 ÷ SGD0.86 (Based on the year to September 2019.)
Is A High Price-to-Earnings Ratio Good?
A higher P/E ratio implies that investors pay a higher price for the earning power of the business. That isn't necessarily good or bad, but a high P/E implies relatively high expectations of what a company can achieve in the future.
Does Haw Par Have A Relatively High Or Low P/E For Its Industry?
The P/E ratio essentially measures market expectations of a company. We can see in the image below that the average P/E (21.5) for companies in the pharmaceuticals industry is higher than Haw Par's P/E.
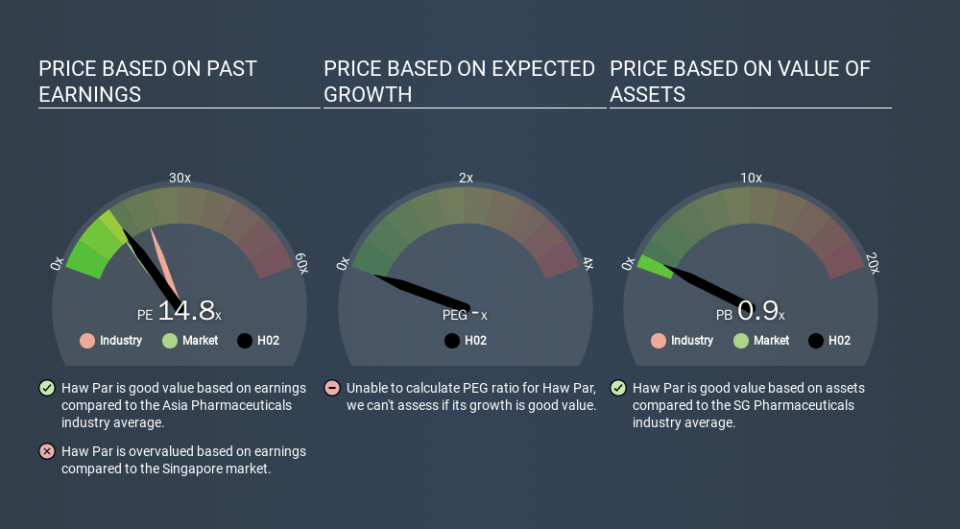
Its relatively low P/E ratio indicates that Haw Par shareholders think it will struggle to do as well as other companies in its industry classification. Since the market seems unimpressed with Haw Par, it's quite possible it could surprise on the upside. You should delve deeper. I like to check if company insiders have been buying or selling.
How Growth Rates Impact P/E Ratios
Earnings growth rates have a big influence on P/E ratios. If earnings are growing quickly, then the 'E' in the equation will increase faster than it would otherwise. Therefore, even if you pay a high multiple of earnings now, that multiple will become lower in the future. A lower P/E should indicate the stock is cheap relative to others -- and that may attract buyers.
Haw Par increased earnings per share by 9.4% last year. And its annual EPS growth rate over 5 years is 8.6%.
Don't Forget: The P/E Does Not Account For Debt or Bank Deposits
It's important to note that the P/E ratio considers the market capitalization, not the enterprise value. Thus, the metric does not reflect cash or debt held by the company. The exact same company would hypothetically deserve a higher P/E ratio if it had a strong balance sheet, than if it had a weak one with lots of debt, because a cashed up company can spend on growth.
Spending on growth might be good or bad a few years later, but the point is that the P/E ratio does not account for the option (or lack thereof).
How Does Haw Par's Debt Impact Its P/E Ratio?
With net cash of S$416m, Haw Par has a very strong balance sheet, which may be important for its business. Having said that, at 15% of its market capitalization the cash hoard would contribute towards a higher P/E ratio.
The Bottom Line On Haw Par's P/E Ratio
Haw Par has a P/E of 14.8. That's higher than the average in its market, which is 13.4. Earnings improved over the last year. And the healthy balance sheet means the company can sustain growth while the P/E suggests shareholders think it will.
Investors should be looking to buy stocks that the market is wrong about. People often underestimate remarkable growth -- so investors can make money when fast growth is not fully appreciated. Although we don't have analyst forecasts you could get a better understanding of its growth by checking out this more detailed historical graph of earnings, revenue and cash flow.
Of course you might be able to find a better stock than Haw Par. So you may wish to see this free collection of other companies that have grown earnings strongly.
If you spot an error that warrants correction, please contact the editor at editorial-team@simplywallst.com. This article by Simply Wall St is general in nature. It does not constitute a recommendation to buy or sell any stock, and does not take account of your objectives, or your financial situation. Simply Wall St has no position in the stocks mentioned.
We aim to bring you long-term focused research analysis driven by fundamental data. Note that our analysis may not factor in the latest price-sensitive company announcements or qualitative material. Thank you for reading.
