Does Hexagon AB (publ)'s (STO:HEXA B) P/E Ratio Signal A Buying Opportunity?

The goal of this article is to teach you how to use price to earnings ratios (P/E ratios). We'll look at Hexagon AB (publ)'s (STO:HEXA B) P/E ratio and reflect on what it tells us about the company's share price. What is Hexagon's P/E ratio? Well, based on the last twelve months it is 21.06. That means that at current prices, buyers pay SEK21.06 for every SEK1 in trailing yearly profits.
Want to participate in a short research study? Help shape the future of investing tools and you could win a $250 gift card!
See our latest analysis for Hexagon
How Do I Calculate Hexagon's Price To Earnings Ratio?
The formula for price to earnings is:
Price to Earnings Ratio = Price per Share (in the reporting currency) ÷ Earnings per Share (EPS)
Or for Hexagon:
P/E of 21.06 = €43.03 (Note: this is the share price in the reporting currency, namely, EUR ) ÷ €2.04 (Based on the trailing twelve months to March 2019.)
Is A High P/E Ratio Good?
The higher the P/E ratio, the higher the price tag of a business, relative to its trailing earnings. That isn't necessarily good or bad, but a high P/E implies relatively high expectations of what a company can achieve in the future.
How Growth Rates Impact P/E Ratios
Probably the most important factor in determining what P/E a company trades on is the earnings growth. If earnings are growing quickly, then the 'E' in the equation will increase faster than it would otherwise. That means even if the current P/E is high, it will reduce over time if the share price stays flat. So while a stock may look expensive based on past earnings, it could be cheap based on future earnings.
Hexagon maintained roughly steady earnings over the last twelve months. But over the longer term (5 years) earnings per share have increased by 15%.
How Does Hexagon's P/E Ratio Compare To Its Peers?
One good way to get a quick read on what market participants expect of a company is to look at its P/E ratio. You can see in the image below that the average P/E (22.3) for companies in the electronic industry is roughly the same as Hexagon's P/E.
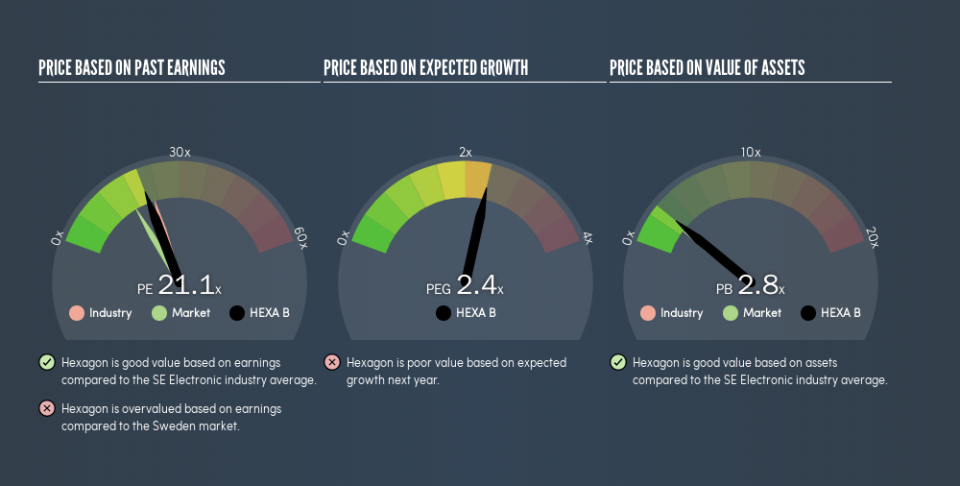
Hexagon's P/E tells us that market participants think its prospects are roughly in line with its industry. The company could surprise by performing better than average, in the future. Further research into factors such asmanagement tenure, could help you form your own view on whether that is likely.
Remember: P/E Ratios Don't Consider The Balance Sheet
It's important to note that the P/E ratio considers the market capitalization, not the enterprise value. In other words, it does not consider any debt or cash that the company may have on the balance sheet. In theory, a company can lower its future P/E ratio by using cash or debt to invest in growth.
Such expenditure might be good or bad, in the long term, but the point here is that the balance sheet is not reflected by this ratio.
So What Does Hexagon's Balance Sheet Tell Us?
Net debt totals 13% of Hexagon's market cap. It would probably deserve a higher P/E ratio if it was net cash, since it would have more options for growth.
The Bottom Line On Hexagon's P/E Ratio
Hexagon's P/E is 21.1 which is above average (16.3) in the SE market. With modest debt relative to its size, and modest earnings growth, the market is likely expecting sustained long-term growth, if not a near-term improvement.
When the market is wrong about a stock, it gives savvy investors an opportunity. If the reality for a company is better than it expects, you can make money by buying and holding for the long term. So this free visualization of the analyst consensus on future earnings could help you make the right decision about whether to buy, sell, or hold.
You might be able to find a better buy than Hexagon. If you want a selection of possible winners, check out this free list of interesting companies that trade on a P/E below 20 (but have proven they can grow earnings).
We aim to bring you long-term focused research analysis driven by fundamental data. Note that our analysis may not factor in the latest price-sensitive company announcements or qualitative material.
If you spot an error that warrants correction, please contact the editor at editorial-team@simplywallst.com. This article by Simply Wall St is general in nature. It does not constitute a recommendation to buy or sell any stock, and does not take account of your objectives, or your financial situation. Simply Wall St has no position in the stocks mentioned. Thank you for reading.
