Does Hopson Development Holdings Limited (HKG:754) Have A Place In Your Dividend Portfolio?

Dividend paying stocks like Hopson Development Holdings Limited (HKG:754) tend to be popular with investors, and for good reason - some research suggests a significant amount of all stock market returns come from reinvested dividends. Yet sometimes, investors buy a popular dividend stock because of its yield, and then lose money if the company's dividend doesn't live up to expectations.
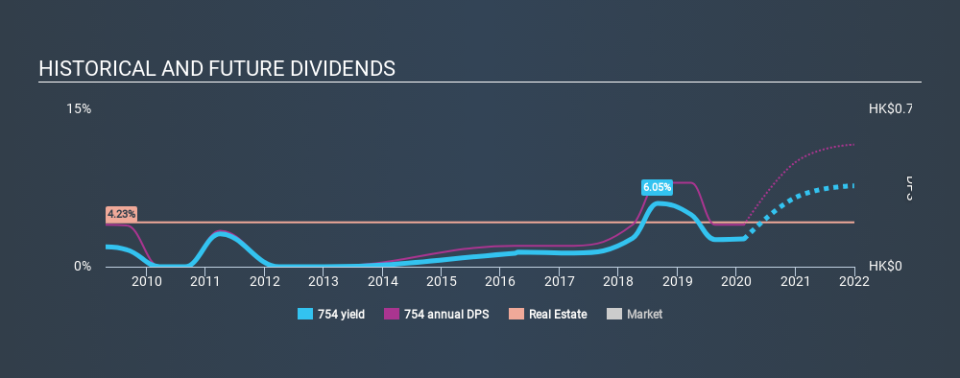
While Hopson Development Holdings's 2.6% dividend yield is not the highest, we think its lengthy payment history is quite interesting. Some simple research can reduce the risk of buying Hopson Development Holdings for its dividend - read on to learn more.
Click the interactive chart for our full dividend analysis
Payout ratios
Dividends are usually paid out of company earnings. If a company is paying more than it earns, then the dividend might become unsustainable - hardly an ideal situation. So we need to form a view on if a company's dividend is sustainable, relative to its net profit after tax. In the last year, Hopson Development Holdings paid out 11% of its profit as dividends. We'd say its dividends are thoroughly covered by earnings.
In addition to comparing dividends against profits, we should inspect whether the company generated enough cash to pay its dividend. Hopson Development Holdings's cash payout ratio last year was 7.8%, which is quite low and suggests that the dividend was thoroughly covered by cash flow. It's positive to see that Hopson Development Holdings's dividend is covered by both profits and cash flow, since this is generally a sign that the dividend is sustainable, and a lower payout ratio usually suggests a greater margin of safety before the dividend gets cut.
Is Hopson Development Holdings's Balance Sheet Risky?
As Hopson Development Holdings has a meaningful amount of debt, we need to check its balance sheet to see if the company might have debt risks. A rough way to check this is with these two simple ratios: a) net debt divided by EBITDA (earnings before interest, tax, depreciation and amortisation), and b) net interest cover. Net debt to EBITDA is a measure of a company's total debt. Net interest cover measures the ability to meet interest payments. Essentially we check that a) the company does not have too much debt, and b) that it can afford to pay the interest. With net debt of 7.32 times its EBITDA, Hopson Development Holdings could be described as a highly leveraged company. While some companies can handle this level of leverage, we'd be concerned about the dividend sustainability if there was any risk of an earnings downturn.
We calculated its interest cover by measuring its earnings before interest and tax (EBIT), and dividing this by the company's net interest expense. Hopson Development Holdings has interest cover of more than 12 times its interest expense, which we think is quite strong. Despite a decent level of interest cover, shareholders should remain cautious about the high level of net debt. Rising rates or tighter debt markets have a nasty habit of making fools of highly-indebted dividend stocks.
Remember, you can always get a snapshot of Hopson Development Holdings's latest financial position, by checking our visualisation of its financial health.
Dividend Volatility
Before buying a stock for its income, we want to see if the dividends have been stable in the past, and if the company has a track record of maintaining its dividend. For the purpose of this article, we only scrutinise the last decade of Hopson Development Holdings's dividend payments. This dividend has been unstable, which we define as having been cut one or more times over this time. During the past ten-year period, the first annual payment was HK$0.20 in 2010, compared to HK$0.20 last year. The dividend has shrunk at a rate of less than 1% a year over this period.
When a company's per-share dividend falls we question if this reflects poorly on either external business conditions, or the company's capital allocation decisions. Either way, we find it hard to get excited about a company with a declining dividend.
Dividend Growth Potential
Given that the dividend has been cut in the past, we need to check if earnings are growing and if that might lead to stronger dividends in the future. Hopson Development Holdings has grown its earnings per share at 5.0% per annum over the past five years. As we saw above, earnings per share growth has not been strong. However, the payout ratio is low, and some companies can deliver adequate dividend performance simply by increasing the payout ratio.
Conclusion
When we look at a dividend stock, we need to form a judgement on whether the dividend will grow, if the company is able to maintain it in a wide range of economic circumstances, and if the dividend payout is sustainable. Firstly, we like that Hopson Development Holdings has low and conservative payout ratios. Unfortunately, earnings growth has also been mediocre, and the company has cut its dividend at least once in the past. Hopson Development Holdings has a number of positive attributes, but it falls slightly short of our (admittedly high) standards. Were there evidence of a strong moat or an attractive valuation, it could still be well worth a look.
Are management backing themselves to deliver performance? Check their shareholdings in Hopson Development Holdings in our latest insider ownership analysis.
If you are a dividend investor, you might also want to look at our curated list of dividend stocks yielding above 3%.
If you spot an error that warrants correction, please contact the editor at editorial-team@simplywallst.com. This article by Simply Wall St is general in nature. It does not constitute a recommendation to buy or sell any stock, and does not take account of your objectives, or your financial situation. Simply Wall St has no position in the stocks mentioned.
We aim to bring you long-term focused research analysis driven by fundamental data. Note that our analysis may not factor in the latest price-sensitive company announcements or qualitative material. Thank you for reading.
