Does Humana Inc.'s (NYSE:HUM) Debt Level Pose A Problem?

Want to participate in a short research study? Help shape the future of investing tools and you could win a $250 gift card!
There are a number of reasons that attract investors towards large-cap companies such as Humana Inc. (NYSE:HUM), with a market cap of US$36b. Market participants who are conscious of risk tend to search for large firms, attracted by the prospect of varied revenue sources and strong returns on capital. However, the key to their continued success lies in its financial health. Let’s take a look at Humana’s leverage and assess its financial strength to get an idea of their ability to fund strategic acquisitions and grow through cyclical pressures. Note that this information is centred entirely on financial health and is a high-level overview, so I encourage you to look further into HUM here.
See our latest analysis for Humana
HUM’s Debt (And Cash Flows)
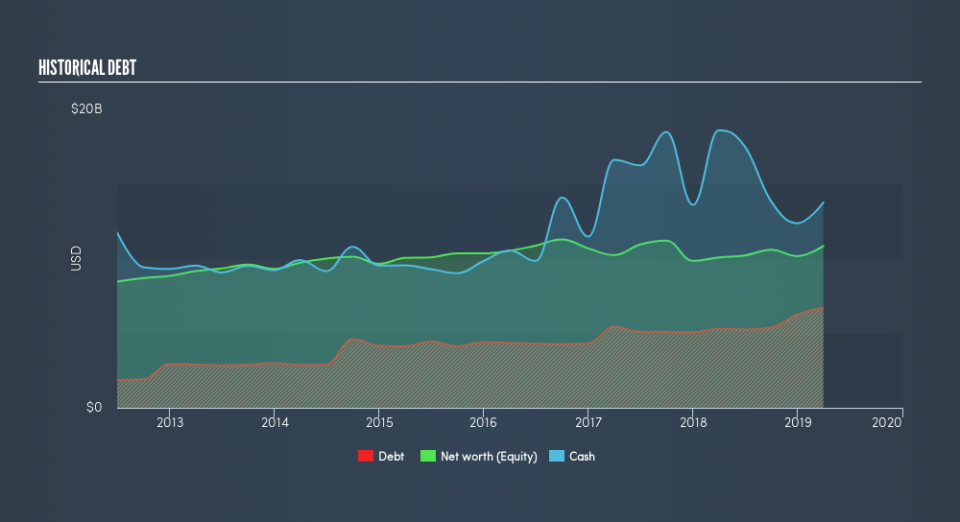
Over the past year, HUM has ramped up its debt from US$5.3b to US$6.7b – this includes long-term debt. With this growth in debt, HUM currently has US$14b remaining in cash and short-term investments to keep the business going. Its negative operating cash flow means calculating cash-to-debt wouldn't be useful. As the purpose of this article is a high-level overview, I won’t be looking at this today, but you can examine some of HUM’s operating efficiency ratios such as ROA here.
Does HUM’s liquid assets cover its short-term commitments?
With current liabilities at US$12b, the company has been able to meet these commitments with a current assets level of US$20b, leading to a 1.65x current account ratio. The current ratio is the number you get when you divide current assets by current liabilities. Generally, for Healthcare companies, this is a reasonable ratio since there is a bit of a cash buffer without leaving too much capital in a low-return environment.
Can HUM service its debt comfortably?
With debt reaching 58% of equity, HUM may be thought of as relatively highly levered. This is common amongst large-cap companies because debt can often be a less expensive alternative to equity due to tax deductibility of interest payments. Since large-caps are seen as safer than their smaller constituents, they tend to enjoy lower cost of capital. No matter how high the company’s debt, if it can easily cover the interest payments, it’s considered to be efficient with its use of excess leverage. As a rule of thumb, a company should have earnings before interest and tax (EBIT) of at least three times the size of net interest. In HUM's case, the ratio of 14.04x suggests that interest is amply covered. It is considered a responsible and reassuring practice to maintain high interest coverage, which makes HUM and other large-cap investments thought to be safe.
Next Steps:
HUM’s cash flow coverage indicates it could improve its operating efficiency in order to meet demand for debt repayments should unforeseen events arise. However, the company exhibits an ability to meet its near-term obligations, which isn't a big surprise for a large-cap. This is only a rough assessment of financial health, and I'm sure HUM has company-specific issues impacting its capital structure decisions. I suggest you continue to research Humana to get a better picture of the stock by looking at:
Future Outlook: What are well-informed industry analysts predicting for HUM’s future growth? Take a look at our free research report of analyst consensus for HUM’s outlook.
Valuation: What is HUM worth today? Is the stock undervalued, even when its growth outlook is factored into its intrinsic value? The intrinsic value infographic in our free research report helps visualize whether HUM is currently mispriced by the market.
Other High-Performing Stocks: Are there other stocks that provide better prospects with proven track records? Explore our free list of these great stocks here.
We aim to bring you long-term focused research analysis driven by fundamental data. Note that our analysis may not factor in the latest price-sensitive company announcements or qualitative material.
If you spot an error that warrants correction, please contact the editor at editorial-team@simplywallst.com. This article by Simply Wall St is general in nature. It does not constitute a recommendation to buy or sell any stock, and does not take account of your objectives, or your financial situation. Simply Wall St has no position in the stocks mentioned. Thank you for reading.

