Does Indian Metals and Ferro Alloys's (NSE:IMFA) Share Price Gain of 86% Match Its Business Performance?

Want to participate in a short research study? Help shape the future of investing tools and you could win a $250 gift card!
By buying an index fund, investors can approximate the average market return. But many of us dare to dream of bigger returns, and build a portfolio ourselves. For example, the Indian Metals and Ferro Alloys Limited (NSE:IMFA) share price is up 86% in the last three years, clearly besting than the market return of around 42% (not including dividends).
View our latest analysis for Indian Metals and Ferro Alloys
In his essay The Superinvestors of Graham-and-Doddsville Warren Buffett described how share prices do not always rationally reflect the value of a business. One way to examine how market sentiment has changed over time is to look at the interaction between a company's share price and its earnings per share (EPS).
During three years of share price growth, Indian Metals and Ferro Alloys achieved compound earnings per share growth of 265% per year. The average annual share price increase of 23% is actually lower than the EPS growth. So it seems investors have become more cautious about the company, over time. This cautious sentiment is reflected in its (fairly low) P/E ratio of 3.44.
You can see below how EPS has changed over time (discover the exact values by clicking on the image).
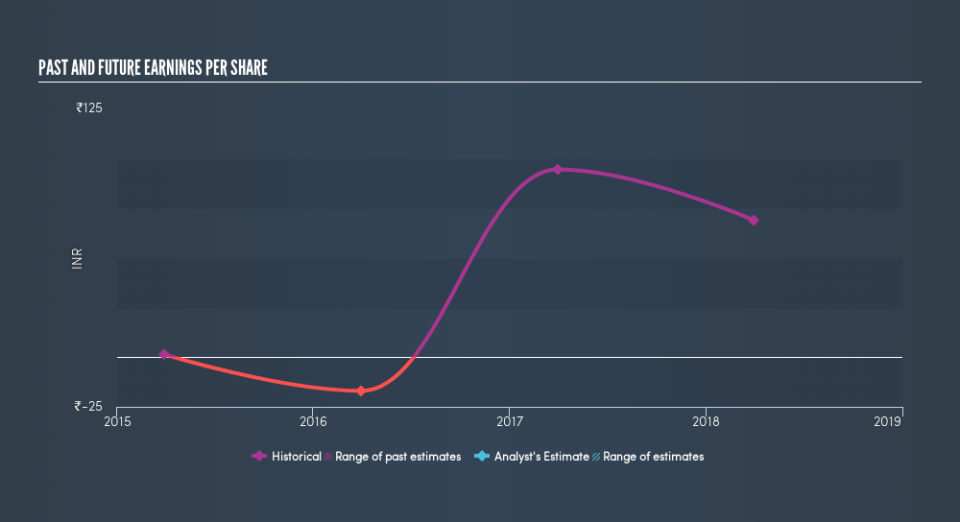
This free interactive report on Indian Metals and Ferro Alloys's earnings, revenue and cash flow is a great place to start, if you want to investigate the stock further.
What About Dividends?
When looking at investment returns, it is important to consider the difference between total shareholder return (TSR) and share price return. The TSR incorporates the value of any spin-offs or discounted capital raisings, along with any dividends, based on the assumption that the dividends are reinvested. Arguably, the TSR gives a more comprehensive picture of the return generated by a stock. In the case of Indian Metals and Ferro Alloys, it has a TSR of 100% for the last 3 years. That exceeds its share price return that we previously mentioned. This is largely a result of its dividend payments!
A Different Perspective
We regret to report that Indian Metals and Ferro Alloys shareholders are down 45% for the year (even including dividends). Unfortunately, that's worse than the broader market decline of 0.2%. Having said that, it's inevitable that some stocks will be oversold in a falling market. The key is to keep your eyes on the fundamental developments. On the bright side, long term shareholders have made money, with a gain of 0.6% per year over half a decade. If the fundamental data continues to indicate long term sustainable growth, the current sell-off could be an opportunity worth considering. Importantly, we haven't analysed Indian Metals and Ferro Alloys's dividend history. This free visual report on its dividends is a must-read if you're thinking of buying.
Of course, you might find a fantastic investment by looking elsewhere. So take a peek at this free list of companies we expect will grow earnings.
Please note, the market returns quoted in this article reflect the market weighted average returns of stocks that currently trade on IN exchanges.
We aim to bring you long-term focused research analysis driven by fundamental data. Note that our analysis may not factor in the latest price-sensitive company announcements or qualitative material.
If you spot an error that warrants correction, please contact the editor at editorial-team@simplywallst.com. This article by Simply Wall St is general in nature. It does not constitute a recommendation to buy or sell any stock, and does not take account of your objectives, or your financial situation. Simply Wall St has no position in the stocks mentioned. Thank you for reading.
