Does J. B. Chemicals & Pharmaceuticals Limited (NSE:JBCHEPHARM) Have A Good P/E Ratio?

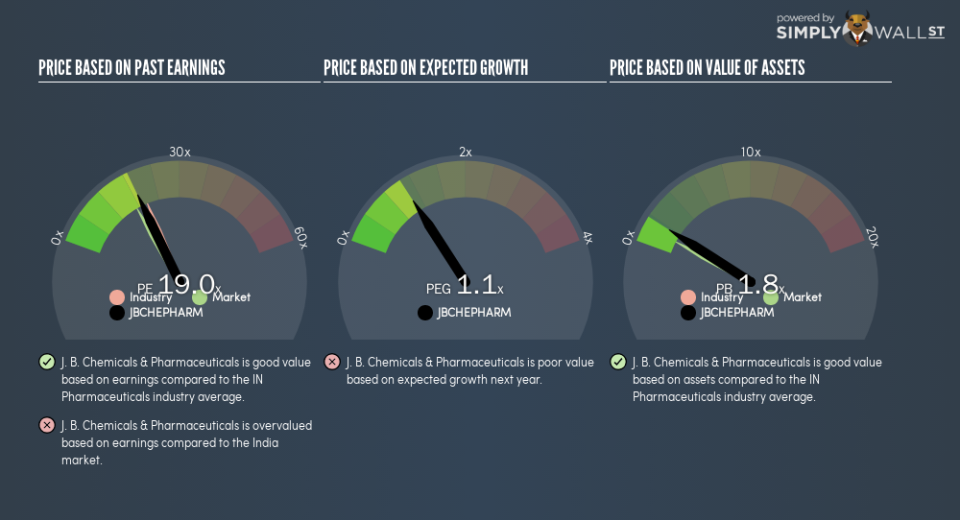
The goal of this article is to teach you how to use price to earnings ratios (P/E ratios). To keep it practical, we’ll show how J. B. Chemicals & Pharmaceuticals Limited’s (NSE:JBCHEPHARM) P/E ratio could help you assess the value on offer. J. B. Chemicals & Pharmaceuticals has a price to earnings ratio of 19.01, based on the last twelve months. That corresponds to an earnings yield of approximately 5.3%.
Check out our latest analysis for J. B. Chemicals & Pharmaceuticals
Want to help shape the future of investing tools and platforms? Take the survey and be part of one of the most advanced studies of stock market investors to date.
How Do I Calculate J. B. Chemicals & Pharmaceuticals’s Price To Earnings Ratio?
The formula for P/E is:
Price to Earnings Ratio = Price per Share ÷ Earnings per Share (EPS)
Or for J. B. Chemicals & Pharmaceuticals:
P/E of 19.01 = ₹313.2 ÷ ₹16.48 (Based on the year to March 2018.)
Is A High Price-to-Earnings Ratio Good?
A higher P/E ratio implies that investors pay a higher price for the earning power of the business. That isn’t necessarily good or bad, but a high P/E implies relatively high expectations of what a company can achieve in the future.
How Growth Rates Impact P/E Ratios
P/E ratios primarily reflect market expectations around earnings growth rates. That’s because companies that grow earnings per share quickly will rapidly increase the ‘E’ in the equation. Therefore, even if you pay a high multiple of earnings now, that multiple will become lower in the future. So while a stock may look expensive based on past earnings, it could be cheap based on future earnings.
J. B. Chemicals & Pharmaceuticals saw earnings per share decrease by 24% last year. But EPS is up 17% over the last 5 years.
How Does J. B. Chemicals & Pharmaceuticals’s P/E Ratio Compare To Its Peers?
We can get an indication of market expectations by looking at the P/E ratio. As you can see below J. B. Chemicals & Pharmaceuticals has a P/E ratio that is fairly close for the average for the pharmaceuticals industry, which is 20.5.
That indicates that the market expects J. B. Chemicals & Pharmaceuticals will perform roughly in line with other companies in its industry. So if J. B. Chemicals & Pharmaceuticals actually outperforms its peers going forward, that should be a positive for the share price. I inform my view byby checking management tenure and remuneration, among other things.
Remember: P/E Ratios Don’t Consider The Balance Sheet
The ‘Price’ in P/E reflects the market capitalization of the company. In other words, it does not consider any debt or cash that the company may have on the balance sheet. In theory, a company can lower its future P/E ratio by using cash or debt to invest in growth.
Such expenditure might be good or bad, in the long term, but the point here is that the balance sheet is not reflected by this ratio.
Is Debt Impacting J. B. Chemicals & Pharmaceuticals’s P/E?
J. B. Chemicals & Pharmaceuticals has net cash of ₹3.8b. That should lead to a higher P/E than if it did have debt, because its strong balance sheets gives it more options.
The Bottom Line On J. B. Chemicals & Pharmaceuticals’s P/E Ratio
J. B. Chemicals & Pharmaceuticals has a P/E of 19. That’s higher than the average in the IN market, which is 17.1. The recent drop in earnings per share would make some investors cautious, but the relatively strong balance sheet will allow the company time to invest in growth. Clearly, the high P/E indicates shareholders think it will!
Investors have an opportunity when market expectations about a stock are wrong. People often underestimate remarkable growth — so investors can make money when fast growth is not fully appreciated. So this free visual report on analyst forecasts could hold they key to an excellent investment decision.
But note: J. B. Chemicals & Pharmaceuticals may not be the best stock to buy. So take a peek at this free list of interesting companies with strong recent earnings growth (and a P/E ratio below 20).
To help readers see past the short term volatility of the financial market, we aim to bring you a long-term focused research analysis purely driven by fundamental data. Note that our analysis does not factor in the latest price-sensitive company announcements.
The author is an independent contributor and at the time of publication had no position in the stocks mentioned. For errors that warrant correction please contact the editor at editorial-team@simplywallst.com.

