How Does Japfa's (SGX:UD2) P/E Compare To Its Industry, After Its Big Share Price Gain?

The Japfa (SGX:UD2) share price has done well in the last month, posting a gain of 31%. But shareholders may not all be feeling jubilant, since the share price is still down 10% in the last year.
All else being equal, a sharp share price increase should make a stock less attractive to potential investors. While the market sentiment towards a stock is very changeable, in the long run, the share price will tend to move in the same direction as earnings per share. The implication here is that deep value investors might steer clear when expectations of a company are too high. One way to gauge market expectations of a stock is to look at its Price to Earnings Ratio (PE Ratio). A high P/E implies that investors have high expectations of what a company can achieve compared to a company with a low P/E ratio.
View our latest analysis for Japfa
Does Japfa Have A Relatively High Or Low P/E For Its Industry?
Japfa's P/E of 13.56 indicates relatively low sentiment towards the stock. The image below shows that Japfa has a lower P/E than the average (17.9) P/E for companies in the food industry.
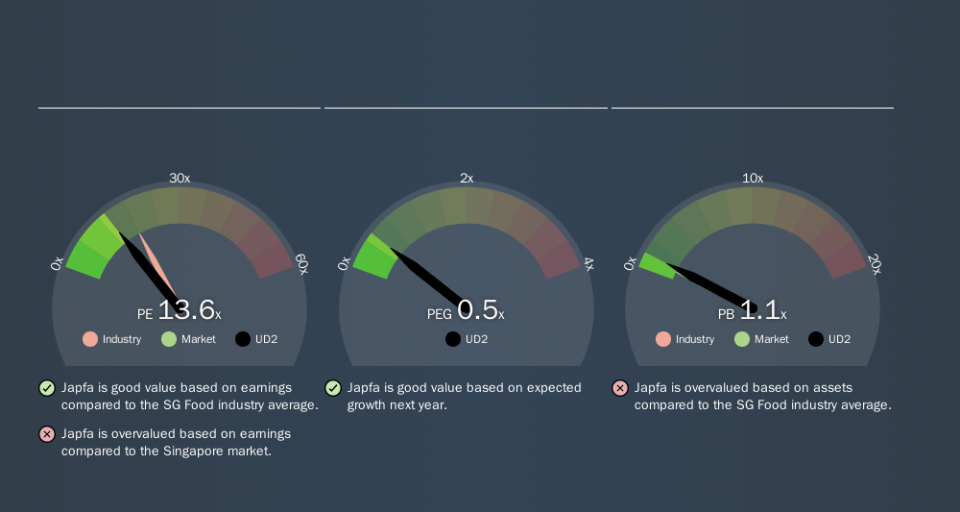
This suggests that market participants think Japfa will underperform other companies in its industry. Since the market seems unimpressed with Japfa, it's quite possible it could surprise on the upside. If you consider the stock interesting, further research is recommended. For example, I often monitor director buying and selling.
How Growth Rates Impact P/E Ratios
When earnings fall, the 'E' decreases, over time. That means unless the share price falls, the P/E will increase in a few years. A higher P/E should indicate the stock is expensive relative to others -- and that may encourage shareholders to sell.
Japfa maintained roughly steady earnings over the last twelve months. But it has grown its earnings per share by 4.1% per year over the last five years. And over the longer term (3 years) earnings per share have decreased 29% annually. So it would be surprising to see a high P/E.
Remember: P/E Ratios Don't Consider The Balance Sheet
Don't forget that the P/E ratio considers market capitalization. Thus, the metric does not reflect cash or debt held by the company. Hypothetically, a company could reduce its future P/E ratio by spending its cash (or taking on debt) to achieve higher earnings.
Such expenditure might be good or bad, in the long term, but the point here is that the balance sheet is not reflected by this ratio.
So What Does Japfa's Balance Sheet Tell Us?
Japfa has net debt worth a very significant 166% of its market capitalization. This level of debt justifies a relatively low P/E, so remain cognizant of the debt, if you're comparing it to other stocks.
The Verdict On Japfa's P/E Ratio
Japfa has a P/E of 13.6. That's around the same as the average in the SG market, which is 13.2. While it does have considerable debt, the market seems to be reassured by recent growth in earnings per share. What is very clear is that the market has become more optimistic about Japfa over the last month, with the P/E ratio rising from 10.4 back then to 13.6 today. If you like to buy stocks that have recently impressed the market, then this one might be a candidate; but if you prefer to invest when there is 'blood in the streets', then you may feel the opportunity has passed.
When the market is wrong about a stock, it gives savvy investors an opportunity. If the reality for a company is better than it expects, you can make money by buying and holding for the long term. So this free visual report on analyst forecasts could hold the key to an excellent investment decision.
Of course you might be able to find a better stock than Japfa. So you may wish to see this free collection of other companies that have grown earnings strongly.
If you spot an error that warrants correction, please contact the editor at editorial-team@simplywallst.com. This article by Simply Wall St is general in nature. It does not constitute a recommendation to buy or sell any stock, and does not take account of your objectives, or your financial situation. Simply Wall St has no position in the stocks mentioned.
We aim to bring you long-term focused research analysis driven by fundamental data. Note that our analysis may not factor in the latest price-sensitive company announcements or qualitative material. Thank you for reading.
