Does Kallebäck Property Invest AB (publ)'s (STO:KAPIAB) P/E Ratio Signal A Buying Opportunity?

Want to participate in a short research study? Help shape the future of investing tools and you could win a $250 gift card!
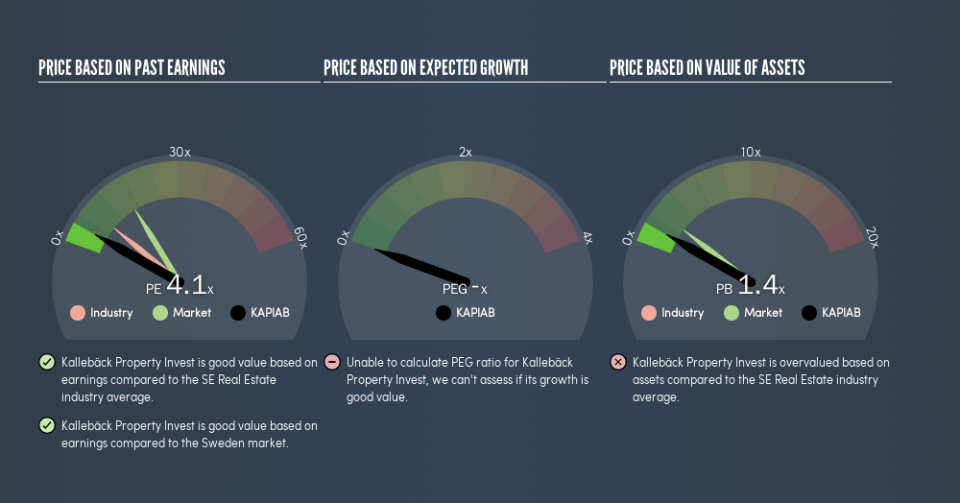
The goal of this article is to teach you how to use price to earnings ratios (P/E ratios). We'll look at Kallebäck Property Invest AB (publ)'s (STO:KAPIAB) P/E ratio and reflect on what it tells us about the company's share price. Kallebäck Property Invest has a price to earnings ratio of 4.06, based on the last twelve months. That is equivalent to an earnings yield of about 25%.
See our latest analysis for Kallebäck Property Invest
How Do You Calculate A P/E Ratio?
The formula for price to earnings is:
Price to Earnings Ratio = Share Price ÷ Earnings per Share (EPS)
Or for Kallebäck Property Invest:
P/E of 4.06 = SEK177.5 ÷ SEK43.75 (Based on the year to December 2018.)
Is A High Price-to-Earnings Ratio Good?
The higher the P/E ratio, the higher the price tag of a business, relative to its trailing earnings. All else being equal, it's better to pay a low price -- but as Warren Buffett said, 'It's far better to buy a wonderful company at a fair price than a fair company at a wonderful price.'
How Does Kallebäck Property Invest's P/E Ratio Compare To Its Peers?
We can get an indication of market expectations by looking at the P/E ratio. The image below shows that Kallebäck Property Invest has a lower P/E than the average (8.4) P/E for companies in the real estate industry.
Kallebäck Property Invest's P/E tells us that market participants think it will not fare as well as its peers in the same industry. While current expectations are low, the stock could be undervalued if the situation is better than the market assumes. You should delve deeper. I like to check if company insiders have been buying or selling.
How Growth Rates Impact P/E Ratios
Earnings growth rates have a big influence on P/E ratios. If earnings are growing quickly, then the 'E' in the equation will increase faster than it would otherwise. That means even if the current P/E is high, it will reduce over time if the share price stays flat. A lower P/E should indicate the stock is cheap relative to others -- and that may attract buyers.
Kallebäck Property Invest's earnings made like a rocket, taking off 278% last year. The cherry on top is that the five year growth rate was an impressive 195% per year. So I'd be surprised if the P/E ratio was not above average.
A Limitation: P/E Ratios Ignore Debt and Cash In The Bank
It's important to note that the P/E ratio considers the market capitalization, not the enterprise value. Thus, the metric does not reflect cash or debt held by the company. Theoretically, a business can improve its earnings (and produce a lower P/E in the future) by investing in growth. That means taking on debt (or spending its cash).
Spending on growth might be good or bad a few years later, but the point is that the P/E ratio does not account for the option (or lack thereof).
So What Does Kallebäck Property Invest's Balance Sheet Tell Us?
Kallebäck Property Invest's net debt is 67% of its market cap. If you want to compare its P/E ratio to other companies, you should absolutely keep in mind it has significant borrowings.
The Bottom Line On Kallebäck Property Invest's P/E Ratio
Kallebäck Property Invest trades on a P/E ratio of 4.1, which is below the SE market average of 16.4. While the EPS growth last year was strong, the significant debt levels reduce the number of options available to management. If the company can continue to grow earnings, then the current P/E may be unjustifiably low.
Investors have an opportunity when market expectations about a stock are wrong. As value investor Benjamin Graham famously said, 'In the short run, the market is a voting machine but in the long run, it is a weighing machine.' Although we don't have analyst forecasts, you could get a better understanding of its growth by checking out this more detailed historical graph of earnings, revenue and cash flow.
Of course you might be able to find a better stock than Kallebäck Property Invest. So you may wish to see this free collection of other companies that have grown earnings strongly.
We aim to bring you long-term focused research analysis driven by fundamental data. Note that our analysis may not factor in the latest price-sensitive company announcements or qualitative material.
If you spot an error that warrants correction, please contact the editor at editorial-team@simplywallst.com. This article by Simply Wall St is general in nature. It does not constitute a recommendation to buy or sell any stock, and does not take account of your objectives, or your financial situation. Simply Wall St has no position in the stocks mentioned. Thank you for reading.
