What Does Kambi Group plc's (STO:KAMBI) P/E Ratio Tell You?

This article is written for those who want to get better at using price to earnings ratios (P/E ratios). We'll apply a basic P/E ratio analysis to Kambi Group plc's (STO:KAMBI), to help you decide if the stock is worth further research. Kambi Group has a price to earnings ratio of 45.97, based on the last twelve months. That corresponds to an earnings yield of approximately 2.2%.
Check out our latest analysis for Kambi Group
How Do You Calculate A P/E Ratio?
The formula for price to earnings is:
Price to Earnings Ratio = Share Price (in reporting currency) ÷ Earnings per Share (EPS)
Or for Kambi Group:
P/E of 45.97 = EUR15.86 (Note: this is the share price in the reporting currency, namely, EUR ) ÷ EUR0.34 (Based on the year to December 2019.)
Is A High Price-to-Earnings Ratio Good?
A higher P/E ratio means that buyers have to pay a higher price for each EUR1 the company has earned over the last year. That isn't necessarily good or bad, but a high P/E implies relatively high expectations of what a company can achieve in the future.
How Does Kambi Group's P/E Ratio Compare To Its Peers?
We can get an indication of market expectations by looking at the P/E ratio. You can see in the image below that the average P/E (17.1) for companies in the hospitality industry is lower than Kambi Group's P/E.
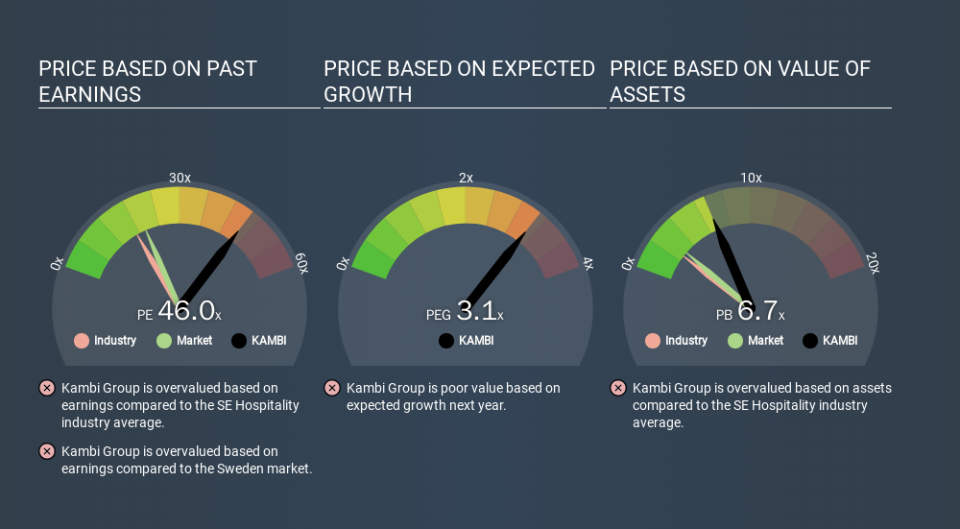
Its relatively high P/E ratio indicates that Kambi Group shareholders think it will perform better than other companies in its industry classification. The market is optimistic about the future, but that doesn't guarantee future growth. So investors should delve deeper. I like to check if company insiders have been buying or selling.
How Growth Rates Impact P/E Ratios
Probably the most important factor in determining what P/E a company trades on is the earnings growth. That's because companies that grow earnings per share quickly will rapidly increase the 'E' in the equation. Therefore, even if you pay a high multiple of earnings now, that multiple will become lower in the future. And as that P/E ratio drops, the company will look cheap, unless its share price increases.
Kambi Group increased earnings per share by 5.7% last year. And it has bolstered its earnings per share by 56% per year over the last five years.
A Limitation: P/E Ratios Ignore Debt and Cash In The Bank
It's important to note that the P/E ratio considers the market capitalization, not the enterprise value. That means it doesn't take debt or cash into account. The exact same company would hypothetically deserve a higher P/E ratio if it had a strong balance sheet, than if it had a weak one with lots of debt, because a cashed up company can spend on growth.
Such expenditure might be good or bad, in the long term, but the point here is that the balance sheet is not reflected by this ratio.
Is Debt Impacting Kambi Group's P/E?
Since Kambi Group holds net cash of €38m, it can spend on growth, justifying a higher P/E ratio than otherwise.
The Verdict On Kambi Group's P/E Ratio
Kambi Group has a P/E of 46.0. That's higher than the average in its market, which is 20.0. Recent earnings growth wasn't bad. And the net cash position provides the company with multiple options. The high P/E suggests the market thinks further growth will come.
Investors have an opportunity when market expectations about a stock are wrong. If the reality for a company is better than it expects, you can make money by buying and holding for the long term. So this free report on the analyst consensus forecasts could help you make a master move on this stock.
Of course you might be able to find a better stock than Kambi Group. So you may wish to see this free collection of other companies that have grown earnings strongly.
If you spot an error that warrants correction, please contact the editor at editorial-team@simplywallst.com. This article by Simply Wall St is general in nature. It does not constitute a recommendation to buy or sell any stock, and does not take account of your objectives, or your financial situation. Simply Wall St has no position in the stocks mentioned.
We aim to bring you long-term focused research analysis driven by fundamental data. Note that our analysis may not factor in the latest price-sensitive company announcements or qualitative material. Thank you for reading.
