Does Kojamo Oyj (HEL:KOJAMO) Have A Healthy Balance Sheet?

Warren Buffett famously said, 'Volatility is far from synonymous with risk.' It's only natural to consider a company's balance sheet when you examine how risky it is, since debt is often involved when a business collapses. Importantly, Kojamo Oyj (HEL:KOJAMO) does carry debt. But should shareholders be worried about its use of debt?
When Is Debt A Problem?
Generally speaking, debt only becomes a real problem when a company can't easily pay it off, either by raising capital or with its own cash flow. If things get really bad, the lenders can take control of the business. However, a more frequent (but still costly) occurrence is where a company must issue shares at bargain-basement prices, permanently diluting shareholders, just to shore up its balance sheet. Having said that, the most common situation is where a company manages its debt reasonably well - and to its own advantage. When we examine debt levels, we first consider both cash and debt levels, together.
View our latest analysis for Kojamo Oyj
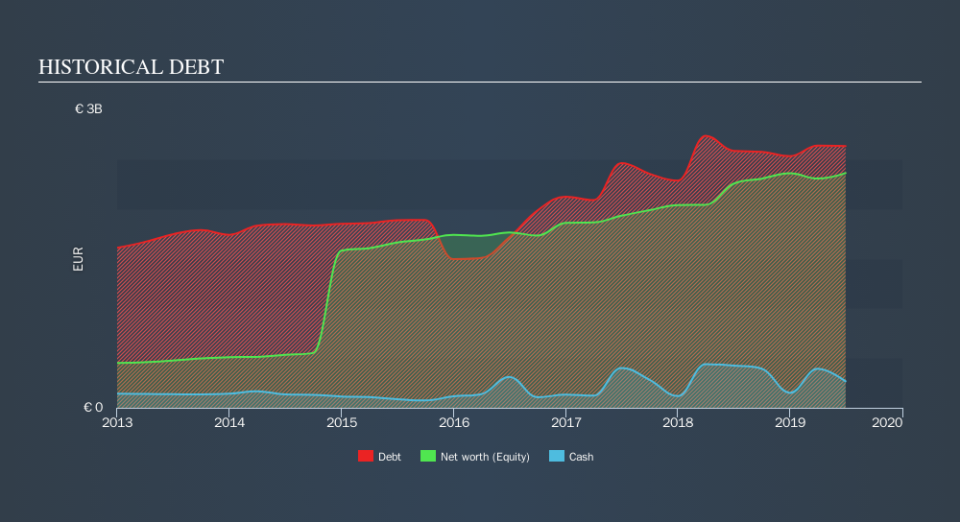
What Is Kojamo Oyj's Debt?
As you can see below, Kojamo Oyj had €2.63b of debt, at June 2019, which is about the same the year before. You can click the chart for greater detail. However, it also had €266.5m in cash, and so its net debt is €2.36b.
A Look At Kojamo Oyj's Liabilities
Zooming in on the latest balance sheet data, we can see that Kojamo Oyj had liabilities of €283.8m due within 12 months and liabilities of €3.00b due beyond that. On the other hand, it had cash of €266.5m and €11.2m worth of receivables due within a year. So its liabilities total €3.00b more than the combination of its cash and short-term receivables.
This deficit is considerable relative to its market capitalization of €3.78b, so it does suggest shareholders should keep an eye on Kojamo Oyj's use of debt. This suggests shareholders would heavily diluted if the company needed to shore up its balance sheet in a hurry.
We use two main ratios to inform us about debt levels relative to earnings. The first is net debt divided by earnings before interest, tax, depreciation, and amortization (EBITDA), while the second is how many times its earnings before interest and tax (EBIT) covers its interest expense (or its interest cover, for short). Thus we consider debt relative to earnings both with and without depreciation and amortization expenses.
Kojamo Oyj has a rather high debt to EBITDA ratio of 11.5 which suggests a meaningful debt load. But the good news is that it boasts fairly comforting interest cover of 4.6 times, suggesting it can responsibly service its obligations. If Kojamo Oyj can keep growing EBIT at last year's rate of 10% over the last year, then it will find its debt load easier to manage. The balance sheet is clearly the area to focus on when you are analysing debt. But ultimately the future profitability of the business will decide if Kojamo Oyj can strengthen its balance sheet over time. So if you're focused on the future you can check out this free report showing analyst profit forecasts.
Finally, a company can only pay off debt with cold hard cash, not accounting profits. So we always check how much of that EBIT is translated into free cash flow. Over the most recent three years, Kojamo Oyj recorded free cash flow worth 61% of its EBIT, which is around normal, given free cash flow excludes interest and tax. This free cash flow puts the company in a good position to pay down debt, when appropriate.
Our View
Kojamo Oyj's net debt to EBITDA was a real negative on this analysis, although the other factors we considered cast it in a significantly better light. But on the bright side, its ability to convert EBIT to free cash flow isn't too shabby at all. Taking the abovementioned factors together we do think Kojamo Oyj's debt poses some risks to the business. So while that leverage does boost returns on equity, we wouldn't really want to see it increase from here. Over time, share prices tend to follow earnings per share, so if you're interested in Kojamo Oyj, you may well want to click here to check an interactive graph of its earnings per share history.
If, after all that, you're more interested in a fast growing company with a rock-solid balance sheet, then check out our list of net cash growth stocks without delay.
We aim to bring you long-term focused research analysis driven by fundamental data. Note that our analysis may not factor in the latest price-sensitive company announcements or qualitative material.
If you spot an error that warrants correction, please contact the editor at editorial-team@simplywallst.com. This article by Simply Wall St is general in nature. It does not constitute a recommendation to buy or sell any stock, and does not take account of your objectives, or your financial situation. Simply Wall St has no position in the stocks mentioned. Thank you for reading.
