Does Landmark Bancorp, Inc.’s (NASDAQ:LARK) P/E Ratio Signal A Buying Opportunity?

Want to participate in a short research study? Help shape the future of investing tools and receive a $20 prize!
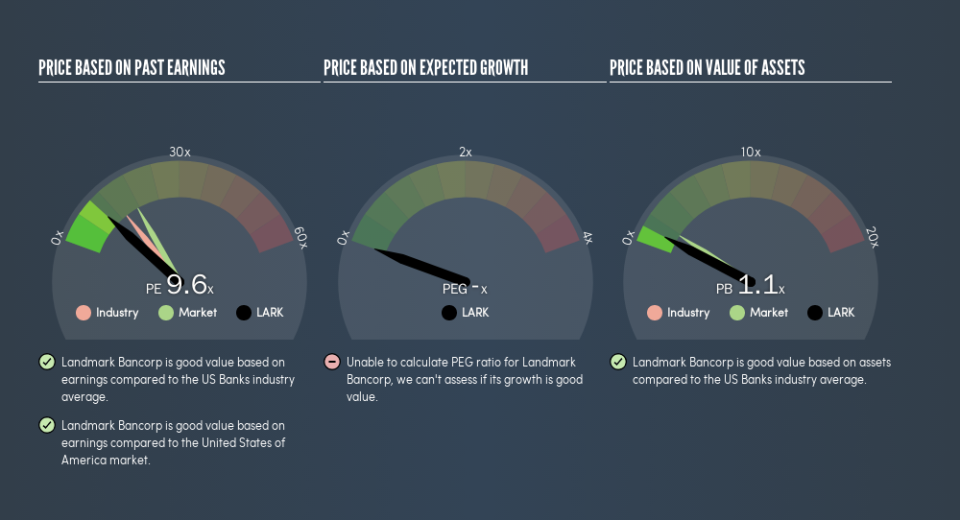
This article is for investors who would like to improve their understanding of price to earnings ratios (P/E ratios). We’ll look at Landmark Bancorp, Inc.’s (NASDAQ:LARK) P/E ratio and reflect on what it tells us about the company’s share price. Landmark Bancorp has a price to earnings ratio of 9.64, based on the last twelve months. That corresponds to an earnings yield of approximately 10%.
View our latest analysis for Landmark Bancorp
How Do You Calculate A P/E Ratio?
The formula for price to earnings is:
Price to Earnings Ratio = Share Price ÷ Earnings per Share (EPS)
Or for Landmark Bancorp:
P/E of 9.64 = $23.1 ÷ $2.4 (Based on the trailing twelve months to December 2018.)
Is A High P/E Ratio Good?
A higher P/E ratio means that investors are paying a higher price for each $1 of company earnings. That is not a good or a bad thing per se, but a high P/E does imply buyers are optimistic about the future.
How Growth Rates Impact P/E Ratios
When earnings fall, the ‘E’ decreases, over time. That means unless the share price falls, the P/E will increase in a few years. Then, a higher P/E might scare off shareholders, pushing the share price down.
It’s nice to see that Landmark Bancorp grew EPS by a stonking 134% in the last year. But earnings per share are down 16% per year over the last three years.
How Does Landmark Bancorp’s P/E Ratio Compare To Its Peers?
We can get an indication of market expectations by looking at the P/E ratio. The image below shows that Landmark Bancorp has a lower P/E than the average (13.6) P/E for companies in the banks industry.
Landmark Bancorp’s P/E tells us that market participants think it will not fare as well as its peers in the same industry. Since the market seems unimpressed with Landmark Bancorp, it’s quite possible it could surprise on the upside. You should delve deeper. I like to check if company insiders have been buying or selling.
Remember: P/E Ratios Don’t Consider The Balance Sheet
It’s important to note that the P/E ratio considers the market capitalization, not the enterprise value. Thus, the metric does not reflect cash or debt held by the company. Theoretically, a business can improve its earnings (and produce a lower P/E in the future), by taking on debt (or spending its remaining cash).
Such expenditure might be good or bad, in the long term, but the point here is that the balance sheet is not reflected by this ratio.
How Does Landmark Bancorp’s Debt Impact Its P/E Ratio?
Net debt totals 37% of Landmark Bancorp’s market cap. This is enough debt that you’d have to make some adjustments before using the P/E ratio to compare it to a company with net cash.
The Verdict On Landmark Bancorp’s P/E Ratio
Landmark Bancorp trades on a P/E ratio of 9.6, which is below the US market average of 17.5. The EPS growth last year was strong, and debt levels are quite reasonable. If it continues to grow, then the current low P/E may prove to be unjustified.
Investors have an opportunity when market expectations about a stock are wrong. As value investor Benjamin Graham famously said, ‘In the short run, the market is a voting machine but in the long run, it is a weighing machine.’ We don’t have analyst forecasts, but shareholders might want to examine this detailed historical graph of earnings, revenue and cash flow.
But note: Landmark Bancorp may not be the best stock to buy. So take a peek at this free list of interesting companies with strong recent earnings growth (and a P/E ratio below 20).
We aim to bring you long-term focused research analysis driven by fundamental data. Note that our analysis may not factor in the latest price-sensitive company announcements or qualitative material.
If you spot an error that warrants correction, please contact the editor at editorial-team@simplywallst.com. This article by Simply Wall St is general in nature. It does not constitute a recommendation to buy or sell any stock, and does not take account of your objectives, or your financial situation. Simply Wall St has no position in the stocks mentioned. Thank you for reading.
