How Does Lantheus Holdings's (NASDAQ:LNTH) P/E Compare To Its Industry, After The Share Price Drop?

To the annoyance of some shareholders, Lantheus Holdings (NASDAQ:LNTH) shares are down a considerable 31% in the last month. Indeed the recent decline has arguably caused some bitterness for shareholders who have held through the 60% drop over twelve months.
Assuming nothing else has changed, a lower share price makes a stock more attractive to potential buyers. While the market sentiment towards a stock is very changeable, in the long run, the share price will tend to move in the same direction as earnings per share. The implication here is that long term investors have an opportunity when expectations of a company are too low. Perhaps the simplest way to get a read on investors' expectations of a business is to look at its Price to Earnings Ratio (PE Ratio). Investors have optimistic expectations of companies with higher P/E ratios, compared to companies with lower P/E ratios.
Check out our latest analysis for Lantheus Holdings
How Does Lantheus Holdings's P/E Ratio Compare To Its Peers?
We can tell from its P/E ratio of 12.73 that sentiment around Lantheus Holdings isn't particularly high. We can see in the image below that the average P/E (37.5) for companies in the medical equipment industry is higher than Lantheus Holdings's P/E.
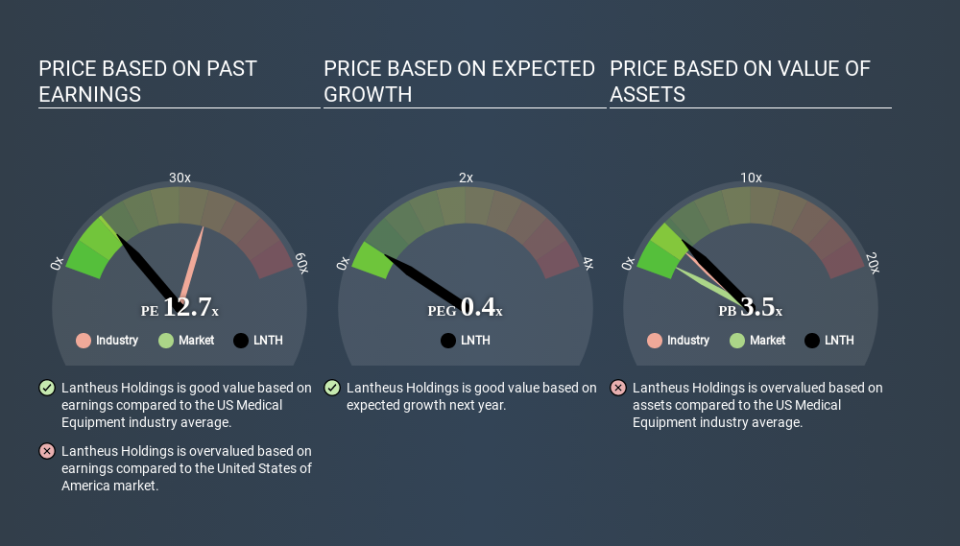
Its relatively low P/E ratio indicates that Lantheus Holdings shareholders think it will struggle to do as well as other companies in its industry classification. Many investors like to buy stocks when the market is pessimistic about their prospects. If you consider the stock interesting, further research is recommended. For example, I often monitor director buying and selling.
How Growth Rates Impact P/E Ratios
If earnings fall then in the future the 'E' will be lower. That means even if the current P/E is low, it will increase over time if the share price stays flat. Then, a higher P/E might scare off shareholders, pushing the share price down.
Lantheus Holdings's earnings per share fell by 23% in the last twelve months.
A Limitation: P/E Ratios Ignore Debt and Cash In The Bank
It's important to note that the P/E ratio considers the market capitalization, not the enterprise value. That means it doesn't take debt or cash into account. Hypothetically, a company could reduce its future P/E ratio by spending its cash (or taking on debt) to achieve higher earnings.
While growth expenditure doesn't always pay off, the point is that it is a good option to have; but one that the P/E ratio ignores.
Is Debt Impacting Lantheus Holdings's P/E?
Net debt totals 25% of Lantheus Holdings's market cap. This could bring some additional risk, and reduce the number of investment options for management; worth remembering if you compare its P/E to businesses without debt.
The Bottom Line On Lantheus Holdings's P/E Ratio
Lantheus Holdings's P/E is 12.7 which is about average (12.4) in the US market. When you consider the lack of EPS growth last year (along with some debt), it seems the market is optimistic about the future for the business. Given Lantheus Holdings's P/E ratio has declined from 18.5 to 12.7 in the last month, we know for sure that the market is significantly less confident about the business today, than it was back then. For those who prefer to invest with the flow of momentum, that might be a bad sign, but for a contrarian, it may signal opportunity.
Investors have an opportunity when market expectations about a stock are wrong. People often underestimate remarkable growth -- so investors can make money when fast growth is not fully appreciated. So this free report on the analyst consensus forecasts could help you make a master move on this stock.
Of course, you might find a fantastic investment by looking at a few good candidates. So take a peek at this free list of companies with modest (or no) debt, trading on a P/E below 20.
If you spot an error that warrants correction, please contact the editor at editorial-team@simplywallst.com. This article by Simply Wall St is general in nature. It does not constitute a recommendation to buy or sell any stock, and does not take account of your objectives, or your financial situation. Simply Wall St has no position in the stocks mentioned.
We aim to bring you long-term focused research analysis driven by fundamental data. Note that our analysis may not factor in the latest price-sensitive company announcements or qualitative material. Thank you for reading.
