How Does Launch Tech's (HKG:2488) P/E Compare To Its Industry, After The Share Price Drop?

To the annoyance of some shareholders, Launch Tech (HKG:2488) shares are down a considerable 31% in the last month. That drop has capped off a tough year for shareholders, with the share price down 52% in that time.
Assuming nothing else has changed, a lower share price makes a stock more attractive to potential buyers. In the long term, share prices tend to follow earnings per share, but in the short term prices bounce around in response to short term factors (which are not always obvious). The implication here is that long term investors have an opportunity when expectations of a company are too low. Perhaps the simplest way to get a read on investors' expectations of a business is to look at its Price to Earnings Ratio (PE Ratio). Investors have optimistic expectations of companies with higher P/E ratios, compared to companies with lower P/E ratios.
Check out our latest analysis for Launch Tech
Does Launch Tech Have A Relatively High Or Low P/E For Its Industry?
Launch Tech's P/E of 16.18 indicates some degree of optimism towards the stock. The image below shows that Launch Tech has a higher P/E than the average (9.5) P/E for companies in the auto components industry.
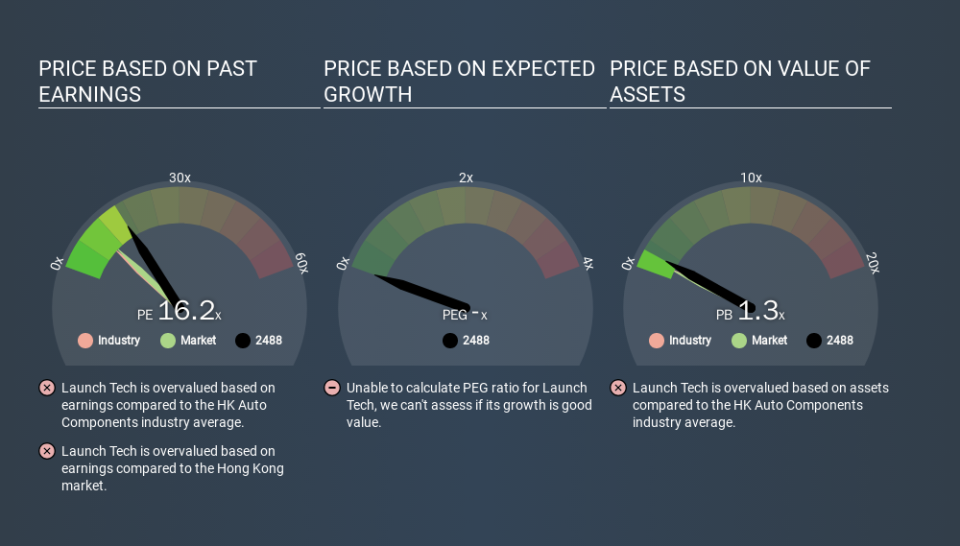
That means that the market expects Launch Tech will outperform other companies in its industry. The market is optimistic about the future, but that doesn't guarantee future growth. So investors should always consider the P/E ratio alongside other factors, such as whether company directors have been buying shares.
How Growth Rates Impact P/E Ratios
Earnings growth rates have a big influence on P/E ratios. That's because companies that grow earnings per share quickly will rapidly increase the 'E' in the equation. That means even if the current P/E is high, it will reduce over time if the share price stays flat. And as that P/E ratio drops, the company will look cheap, unless its share price increases.
Launch Tech's earnings made like a rocket, taking off 107% last year. The cherry on top is that the five year growth rate was an impressive 46% per year. So I'd be surprised if the P/E ratio was not above average.
Don't Forget: The P/E Does Not Account For Debt or Bank Deposits
The 'Price' in P/E reflects the market capitalization of the company. That means it doesn't take debt or cash into account. In theory, a company can lower its future P/E ratio by using cash or debt to invest in growth.
Such spending might be good or bad, overall, but the key point here is that you need to look at debt to understand the P/E ratio in context.
How Does Launch Tech's Debt Impact Its P/E Ratio?
Since Launch Tech holds net cash of CN¥46m, it can spend on growth, justifying a higher P/E ratio than otherwise.
The Verdict On Launch Tech's P/E Ratio
Launch Tech's P/E is 16.2 which is above average (10.1) in its market. The excess cash it carries is the gravy on top its fast EPS growth. So based on this analysis we'd expect Launch Tech to have a high P/E ratio. Given Launch Tech's P/E ratio has declined from 23.3 to 16.2 in the last month, we know for sure that the market is significantly less confident about the business today, than it was back then. For those who don't like to trade against momentum, that could be a warning sign, but a contrarian investor might want to take a closer look.
Investors should be looking to buy stocks that the market is wrong about. People often underestimate remarkable growth -- so investors can make money when fast growth is not fully appreciated. Although we don't have analyst forecasts you might want to assess this data-rich visualization of earnings, revenue and cash flow.
Of course you might be able to find a better stock than Launch Tech. So you may wish to see this free collection of other companies that have grown earnings strongly.
If you spot an error that warrants correction, please contact the editor at editorial-team@simplywallst.com. This article by Simply Wall St is general in nature. It does not constitute a recommendation to buy or sell any stock, and does not take account of your objectives, or your financial situation. Simply Wall St has no position in the stocks mentioned.
We aim to bring you long-term focused research analysis driven by fundamental data. Note that our analysis may not factor in the latest price-sensitive company announcements or qualitative material. Thank you for reading.
