Does Leidos Holdings, Inc.'s (NYSE:LDOS) P/E Ratio Signal A Buying Opportunity?

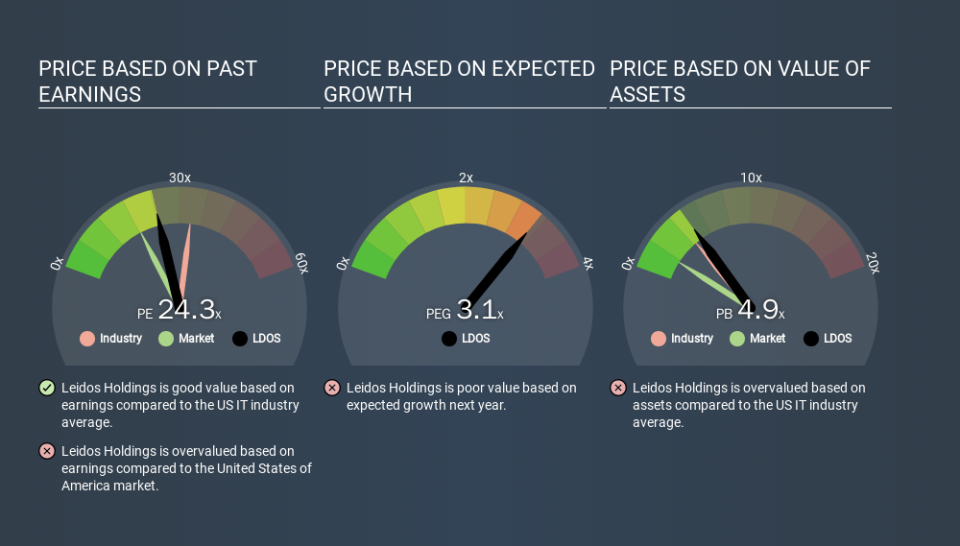
The goal of this article is to teach you how to use price to earnings ratios (P/E ratios). To keep it practical, we'll show how Leidos Holdings, Inc.'s (NYSE:LDOS) P/E ratio could help you assess the value on offer. What is Leidos Holdings's P/E ratio? Well, based on the last twelve months it is 24.27. That is equivalent to an earnings yield of about 4.1%.
View our latest analysis for Leidos Holdings
How Do You Calculate Leidos Holdings's P/E Ratio?
The formula for P/E is:
Price to Earnings Ratio = Price per Share ÷ Earnings per Share (EPS)
Or for Leidos Holdings:
P/E of 24.27 = USD112.81 ÷ USD4.65 (Based on the year to September 2019.)
Is A High Price-to-Earnings Ratio Good?
A higher P/E ratio means that buyers have to pay a higher price for each USD1 the company has earned over the last year. That is not a good or a bad thing per se, but a high P/E does imply buyers are optimistic about the future.
How Does Leidos Holdings's P/E Ratio Compare To Its Peers?
The P/E ratio indicates whether the market has higher or lower expectations of a company. We can see in the image below that the average P/E (33.1) for companies in the it industry is higher than Leidos Holdings's P/E.
Its relatively low P/E ratio indicates that Leidos Holdings shareholders think it will struggle to do as well as other companies in its industry classification. Many investors like to buy stocks when the market is pessimistic about their prospects. It is arguably worth checking if insiders are buying shares, because that might imply they believe the stock is undervalued.
How Growth Rates Impact P/E Ratios
Earnings growth rates have a big influence on P/E ratios. If earnings are growing quickly, then the 'E' in the equation will increase faster than it would otherwise. That means even if the current P/E is high, it will reduce over time if the share price stays flat. And as that P/E ratio drops, the company will look cheap, unless its share price increases.
It's nice to see that Leidos Holdings grew EPS by a stonking 40% in the last year. And its annual EPS growth rate over 3 years is 3.8%. So we'd generally expect it to have a relatively high P/E ratio.
A Limitation: P/E Ratios Ignore Debt and Cash In The Bank
Don't forget that the P/E ratio considers market capitalization. That means it doesn't take debt or cash into account. Hypothetically, a company could reduce its future P/E ratio by spending its cash (or taking on debt) to achieve higher earnings.
While growth expenditure doesn't always pay off, the point is that it is a good option to have; but one that the P/E ratio ignores.
Is Debt Impacting Leidos Holdings's P/E?
Leidos Holdings's net debt is 15% of its market cap. That's enough debt to impact the P/E ratio a little; so keep it in mind if you're comparing it to companies without debt.
The Bottom Line On Leidos Holdings's P/E Ratio
Leidos Holdings's P/E is 24.3 which is above average (18.4) in its market. Its debt levels do not imperil its balance sheet and its EPS growth is very healthy indeed. So on this analysis a high P/E ratio seems reasonable.
Investors should be looking to buy stocks that the market is wrong about. If the reality for a company is better than it expects, you can make money by buying and holding for the long term. So this free visualization of the analyst consensus on future earnings could help you make the right decision about whether to buy, sell, or hold.
But note: Leidos Holdings may not be the best stock to buy. So take a peek at this free list of interesting companies with strong recent earnings growth (and a P/E ratio below 20).
If you spot an error that warrants correction, please contact the editor at editorial-team@simplywallst.com. This article by Simply Wall St is general in nature. It does not constitute a recommendation to buy or sell any stock, and does not take account of your objectives, or your financial situation. Simply Wall St has no position in the stocks mentioned.
We aim to bring you long-term focused research analysis driven by fundamental data. Note that our analysis may not factor in the latest price-sensitive company announcements or qualitative material. Thank you for reading.

