Does The Market Have A Low Tolerance For Finbar Group Limited's (ASX:FRI) Mixed Fundamentals?
With its stock down 6.6% over the past month, it is easy to disregard Finbar Group (ASX:FRI). It is possible that the markets have ignored the company's differing financials and decided to lean-in to the negative sentiment. Long-term fundamentals are usually what drive market outcomes, so it's worth paying close attention. Particularly, we will be paying attention to Finbar Group's ROE today.
Return on equity or ROE is a key measure used to assess how efficiently a company's management is utilizing the company's capital. Put another way, it reveals the company's success at turning shareholder investments into profits.
See our latest analysis for Finbar Group
How Is ROE Calculated?
Return on equity can be calculated by using the formula:
Return on Equity = Net Profit (from continuing operations) ÷ Shareholders' Equity
So, based on the above formula, the ROE for Finbar Group is:
3.6% = AU$8.8m ÷ AU$243m (Based on the trailing twelve months to June 2021).
The 'return' is the yearly profit. Another way to think of that is that for every A$1 worth of equity, the company was able to earn A$0.04 in profit.
Why Is ROE Important For Earnings Growth?
We have already established that ROE serves as an efficient profit-generating gauge for a company's future earnings. Based on how much of its profits the company chooses to reinvest or "retain", we are then able to evaluate a company's future ability to generate profits. Assuming everything else remains unchanged, the higher the ROE and profit retention, the higher the growth rate of a company compared to companies that don't necessarily bear these characteristics.
Finbar Group's Earnings Growth And 3.6% ROE
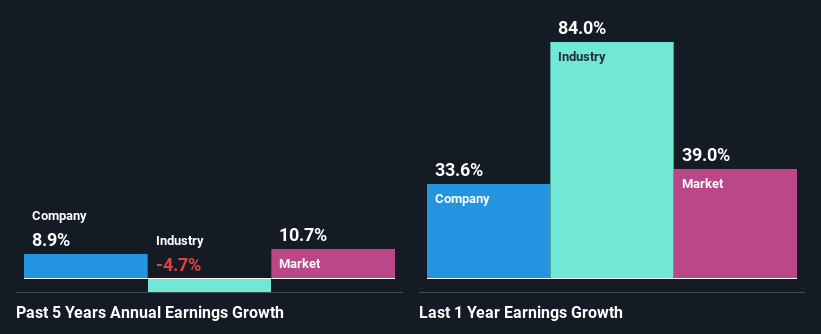
It is quite clear that Finbar Group's ROE is rather low. Even compared to the average industry ROE of 6.9%, the company's ROE is quite dismal. However, the moderate 8.9% net income growth seen by Finbar Group over the past five years is definitely a positive. We believe that there might be other aspects that are positively influencing the company's earnings growth. Such as - high earnings retention or an efficient management in place.
Next, on comparing with the industry net income growth, we found that the growth figure reported by Finbar Group compares quite favourably to the industry average, which shows a decline of 4.7% in the same period.
Earnings growth is an important metric to consider when valuing a stock. What investors need to determine next is if the expected earnings growth, or the lack of it, is already built into the share price. By doing so, they will have an idea if the stock is headed into clear blue waters or if swampy waters await. Is Finbar Group fairly valued compared to other companies? These 3 valuation measures might help you decide.
Is Finbar Group Efficiently Re-investing Its Profits?
Finbar Group has a very high three-year median payout ratio of 117% suggesting that the company's shareholders are getting paid from more than just the company's earnings. In spite of this, the company was able to grow its earnings respectably, as we saw above. It would still be worth keeping an eye on that high payout ratio, if for some reason the company runs into problems and business deteriorates.
Besides, Finbar Group has been paying dividends for at least ten years or more. This shows that the company is committed to sharing profits with its shareholders.
Summary
In total, we're a bit ambivalent about Finbar Group's performance. While no doubt its earnings growth is pretty substantial, its ROE and earnings retention is quite poor. So while the company has managed to grow its earnings in spite of this, we are unconvinced if this growth could extend, especially during troubled times. So far, we've only made a quick discussion around the company's earnings growth. To gain further insights into Finbar Group's past profit growth, check out this visualization of past earnings, revenue and cash flows.
This article by Simply Wall St is general in nature. We provide commentary based on historical data and analyst forecasts only using an unbiased methodology and our articles are not intended to be financial advice. It does not constitute a recommendation to buy or sell any stock, and does not take account of your objectives, or your financial situation. We aim to bring you long-term focused analysis driven by fundamental data. Note that our analysis may not factor in the latest price-sensitive company announcements or qualitative material. Simply Wall St has no position in any stocks mentioned.
Have feedback on this article? Concerned about the content? Get in touch with us directly. Alternatively, email editorial-team (at) simplywallst.com.
