How Does Microequities Asset Management Group's (ASX:MAM) P/E Compare To Its Industry, After Its Big Share Price Gain?

Microequities Asset Management Group (ASX:MAM) shares have continued recent momentum with a 33% gain in the last month alone. The full year gain of 22% is pretty reasonable, too.
Assuming no other changes, a sharply higher share price makes a stock less attractive to potential buyers. While the market sentiment towards a stock is very changeable, in the long run, the share price will tend to move in the same direction as earnings per share. So some would prefer to hold off buying when there is a lot of optimism towards a stock. Perhaps the simplest way to get a read on investors' expectations of a business is to look at its Price to Earnings Ratio (PE Ratio). A high P/E implies that investors have high expectations of what a company can achieve compared to a company with a low P/E ratio.
Check out our latest analysis for Microequities Asset Management Group
How Does Microequities Asset Management Group's P/E Ratio Compare To Its Peers?
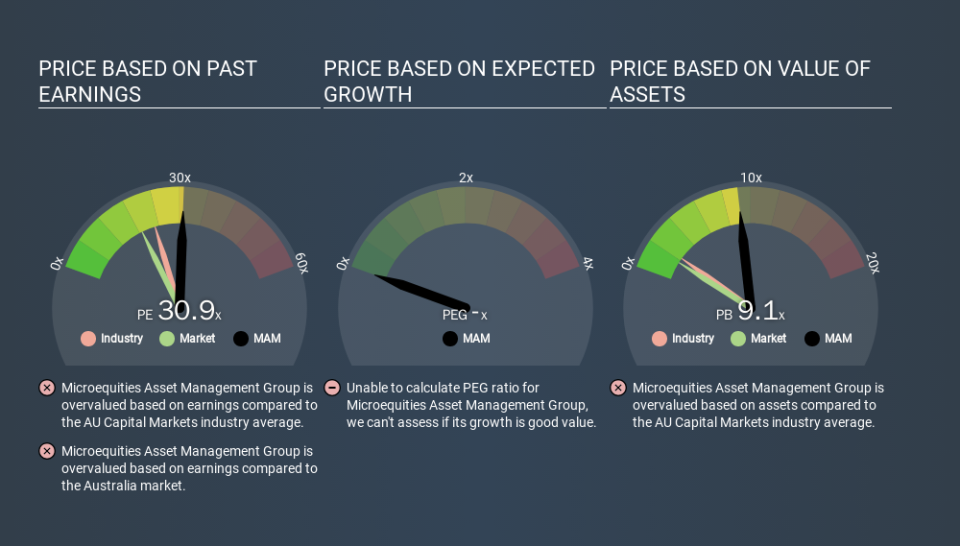
We can tell from its P/E ratio of 30.91 that there is some investor optimism about Microequities Asset Management Group. You can see in the image below that the average P/E (22.8) for companies in the capital markets industry is lower than Microequities Asset Management Group's P/E.
Microequities Asset Management Group's P/E tells us that market participants think the company will perform better than its industry peers, going forward. Clearly the market expects growth, but it isn't guaranteed. So further research is always essential. I often monitor director buying and selling.
How Growth Rates Impact P/E Ratios
Generally speaking the rate of earnings growth has a profound impact on a company's P/E multiple. When earnings grow, the 'E' increases, over time. That means even if the current P/E is high, it will reduce over time if the share price stays flat. So while a stock may look expensive based on past earnings, it could be cheap based on future earnings.
Microequities Asset Management Group's earnings per share fell by 51% in the last twelve months.
Don't Forget: The P/E Does Not Account For Debt or Bank Deposits
The 'Price' in P/E reflects the market capitalization of the company. In other words, it does not consider any debt or cash that the company may have on the balance sheet. The exact same company would hypothetically deserve a higher P/E ratio if it had a strong balance sheet, than if it had a weak one with lots of debt, because a cashed up company can spend on growth.
While growth expenditure doesn't always pay off, the point is that it is a good option to have; but one that the P/E ratio ignores.
Is Debt Impacting Microequities Asset Management Group's P/E?
Microequities Asset Management Group has net cash of AU$4.7m. That should lead to a higher P/E than if it did have debt, because its strong balance sheets gives it more options.
The Verdict On Microequities Asset Management Group's P/E Ratio
Microequities Asset Management Group's P/E is 30.9 which is above average (18.8) in its market. The recent drop in earnings per share would make some investors cautious, but the net cash position means the company has time to improve: and the high P/E suggests the market thinks it will. What is very clear is that the market has become significantly more optimistic about Microequities Asset Management Group over the last month, with the P/E ratio rising from 23.2 back then to 30.9 today. For those who prefer to invest with the flow of momentum, that might mean it's time to put the stock on a watchlist, or research it. But the contrarian may see it as a missed opportunity.
When the market is wrong about a stock, it gives savvy investors an opportunity. As value investor Benjamin Graham famously said, 'In the short run, the market is a voting machine but in the long run, it is a weighing machine. We don't have analyst forecasts, but you could get a better understanding of its growth by checking out this more detailed historical graph of earnings, revenue and cash flow.
You might be able to find a better buy than Microequities Asset Management Group. If you want a selection of possible winners, check out this free list of interesting companies that trade on a P/E below 20 (but have proven they can grow earnings).
If you spot an error that warrants correction, please contact the editor at editorial-team@simplywallst.com. This article by Simply Wall St is general in nature. It does not constitute a recommendation to buy or sell any stock, and does not take account of your objectives, or your financial situation. Simply Wall St has no position in the stocks mentioned.
We aim to bring you long-term focused research analysis driven by fundamental data. Note that our analysis may not factor in the latest price-sensitive company announcements or qualitative material. Thank you for reading.

