Does Moneysupermarket.com Group PLC (LON:MONY) Have A Good P/E Ratio?

The goal of this article is to teach you how to use price to earnings ratios (P/E ratios). To keep it practical, we’ll show how Moneysupermarket.com Group PLC’s (LON:MONY) P/E ratio could help you assess the value on offer. Moneysupermarket.com Group has a price to earnings ratio of 21.31, based on the last twelve months. In other words, at today’s prices, investors are paying £21.31 for every £1 in prior year profit.
See our latest analysis for Moneysupermarket.com Group
How Do You Calculate A P/E Ratio?
The formula for price to earnings is:
Price to Earnings Ratio = Share Price ÷ Earnings per Share (EPS)
Or for Moneysupermarket.com Group:
P/E of 21.31 = £3.44 ÷ £0.16 (Based on the trailing twelve months to December 2018.)
Is A High Price-to-Earnings Ratio Good?
A higher P/E ratio implies that investors pay a higher price for the earning power of the business. That isn’t a good or a bad thing on its own, but a high P/E means that buyers have a higher opinion of the business’s prospects, relative to stocks with a lower P/E.
How Growth Rates Impact P/E Ratios
P/E ratios primarily reflect market expectations around earnings growth rates. When earnings grow, the ‘E’ increases, over time. That means even if the current P/E is high, it will reduce over time if the share price stays flat. Then, a lower P/E should attract more buyers, pushing the share price up.
Most would be impressed by Moneysupermarket.com Group earnings growth of 12% in the last year. And it has bolstered its earnings per share by 15% per year over the last five years. This could arguably justify a relatively high P/E ratio.
How Does Moneysupermarket.com Group’s P/E Ratio Compare To Its Peers?
We can get an indication of market expectations by looking at the P/E ratio. If you look at the image below, you can see Moneysupermarket.com Group has a lower P/E than the average (24.7) in the online retail industry classification.
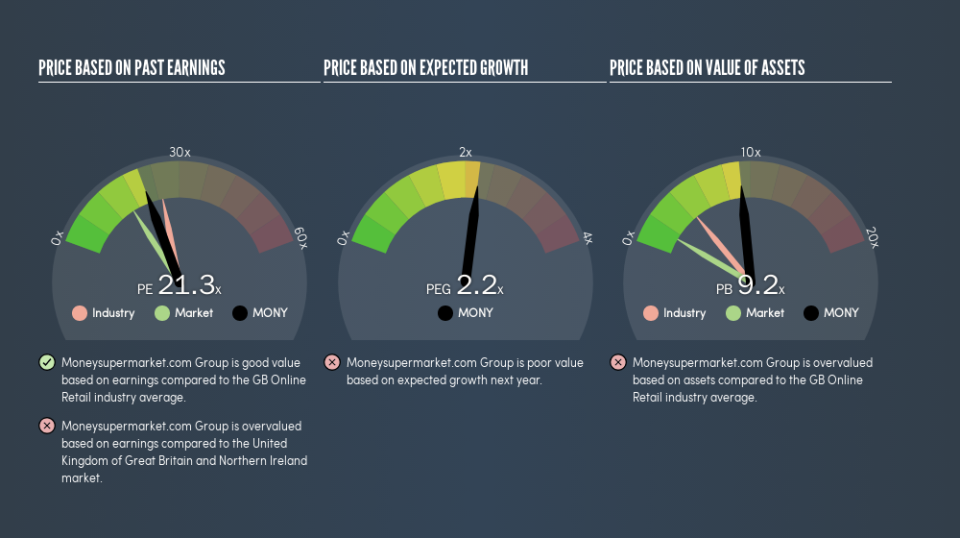
Its relatively low P/E ratio indicates that Moneysupermarket.com Group shareholders think it will struggle to do as well as other companies in its industry classification. Many investors like to buy stocks when the market is pessimistic about their prospects. You should delve deeper. I like to check if company insiders have been buying or selling.
Remember: P/E Ratios Don’t Consider The Balance Sheet
It’s important to note that the P/E ratio considers the market capitalization, not the enterprise value. In other words, it does not consider any debt or cash that the company may have on the balance sheet. In theory, a company can lower its future P/E ratio by using cash or debt to invest in growth.
Spending on growth might be good or bad a few years later, but the point is that the P/E ratio does not account for the option (or lack thereof).
Is Debt Impacting Moneysupermarket.com Group’s P/E?
Moneysupermarket.com Group has net cash of UK£30m. That should lead to a higher P/E than if it did have debt, because its strong balance sheets gives it more options.
The Bottom Line On Moneysupermarket.com Group’s P/E Ratio
Moneysupermarket.com Group trades on a P/E ratio of 21.3, which is above the GB market average of 15.9. With cash in the bank the company has plenty of growth options — and it is already on the right track. Therefore it seems reasonable that the market would have relatively high expectations of the company
Investors have an opportunity when market expectations about a stock are wrong. As value investor Benjamin Graham famously said, ‘In the short run, the market is a voting machine but in the long run, it is a weighing machine.’ So this free visual report on analyst forecasts could hold the key to an excellent investment decision.
Of course, you might find a fantastic investment by looking at a few good candidates. So take a peek at this free list of companies with modest (or no) debt, trading on a P/E below 20.
We aim to bring you long-term focused research analysis driven by fundamental data. Note that our analysis may not factor in the latest price-sensitive company announcements or qualitative material.
If you spot an error that warrants correction, please contact the editor at editorial-team@simplywallst.com. This article by Simply Wall St is general in nature. It does not constitute a recommendation to buy or sell any stock, and does not take account of your objectives, or your financial situation. Simply Wall St has no position in the stocks mentioned. Thank you for reading.
