What Does National Instruments Corporation’s (NASDAQ:NATI) P/E Ratio Tell You?

Want to participate in a short research study? Help shape the future of investing tools and receive a $20 prize!
This article is for investors who would like to improve their understanding of price to earnings ratios (P/E ratios). We’ll show how you can use National Instruments Corporation’s (NASDAQ:NATI) P/E ratio to inform your assessment of the investment opportunity. National Instruments has a P/E ratio of 39.19, based on the last twelve months. That is equivalent to an earnings yield of about 2.6%.
Check out our latest analysis for National Instruments
How Do You Calculate A P/E Ratio?
The formula for P/E is:
Price to Earnings Ratio = Share Price ÷ Earnings per Share (EPS)
Or for National Instruments:
P/E of 39.19 = $46.04 ÷ $1.17 (Based on the trailing twelve months to December 2018.)
Is A High Price-to-Earnings Ratio Good?
A higher P/E ratio means that investors are paying a higher price for each $1 of company earnings. That isn’t a good or a bad thing on its own, but a high P/E means that buyers have a higher opinion of the business’s prospects, relative to stocks with a lower P/E.
How Growth Rates Impact P/E Ratios
Probably the most important factor in determining what P/E a company trades on is the earnings growth. Earnings growth means that in the future the ‘E’ will be higher. Therefore, even if you pay a high multiple of earnings now, that multiple will become lower in the future. A lower P/E should indicate the stock is cheap relative to others — and that may attract buyers.
Notably, National Instruments grew EPS by a whopping 192% in the last year. Unfortunately, earnings per share are down 4.4% a year, over 5 years.
How Does National Instruments’s P/E Ratio Compare To Its Peers?
The P/E ratio essentially measures market expectations of a company. You can see in the image below that the average P/E (20.2) for companies in the electronic industry is lower than National Instruments’s P/E.
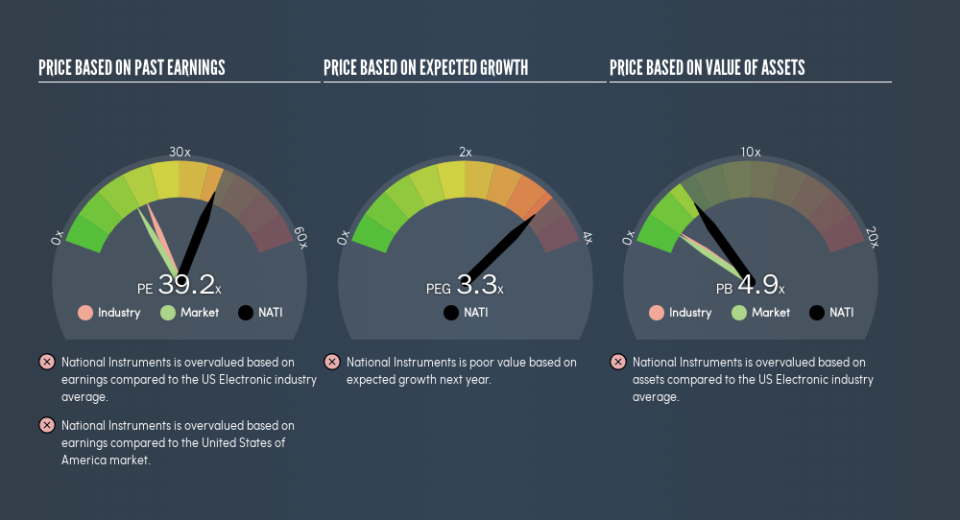
That means that the market expects National Instruments will outperform other companies in its industry. The market is optimistic about the future, but that doesn’t guarantee future growth. So investors should always consider the P/E ratio alongside other factors, such as whether company directors have been buying shares.
Remember: P/E Ratios Don’t Consider The Balance Sheet
It’s important to note that the P/E ratio considers the market capitalization, not the enterprise value. Thus, the metric does not reflect cash or debt held by the company. In theory, a company can lower its future P/E ratio by using cash or debt to invest in growth.
Such expenditure might be good or bad, in the long term, but the point here is that the balance sheet is not reflected by this ratio.
Is Debt Impacting National Instruments’s P/E?
National Instruments has net cash of US$531m. That should lead to a higher P/E than if it did have debt, because its strong balance sheets gives it more options.
The Bottom Line On National Instruments’s P/E Ratio
National Instruments’s P/E is 39.2 which is above average (17.5) in the US market. With cash in the bank the company has plenty of growth options — and it is already on the right track. So it does not seem strange that the P/E is above average.
Investors have an opportunity when market expectations about a stock are wrong. People often underestimate remarkable growth — so investors can make money when fast growth is not fully appreciated. So this free report on the analyst consensus forecasts could help you make a master move on this stock.
Of course you might be able to find a better stock than National Instruments. So you may wish to see this free collection of other companies that have grown earnings strongly.
We aim to bring you long-term focused research analysis driven by fundamental data. Note that our analysis may not factor in the latest price-sensitive company announcements or qualitative material.
If you spot an error that warrants correction, please contact the editor at editorial-team@simplywallst.com. This article by Simply Wall St is general in nature. It does not constitute a recommendation to buy or sell any stock, and does not take account of your objectives, or your financial situation. Simply Wall St has no position in the stocks mentioned. Thank you for reading.
