Does Neways Electronics International N.V.'s (AMS:NEWAY) P/E Ratio Signal A Buying Opportunity?

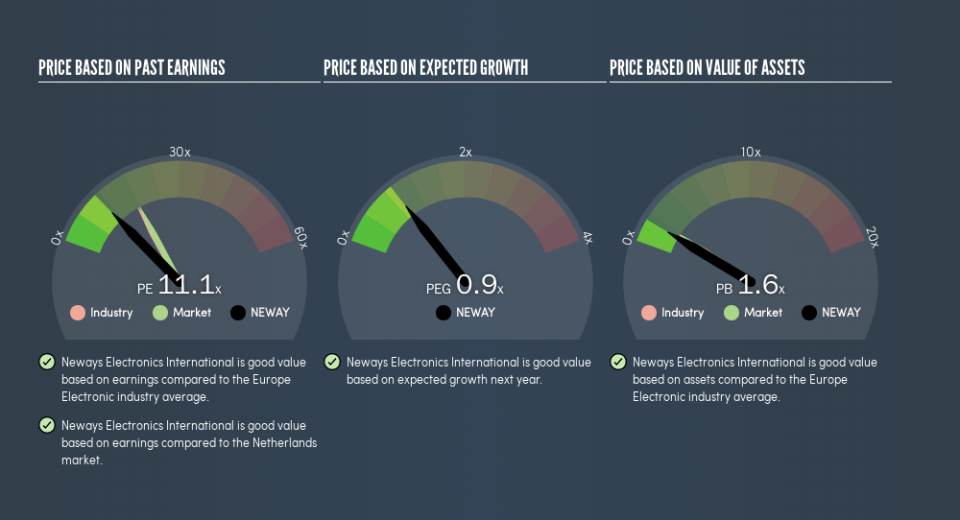
The goal of this article is to teach you how to use price to earnings ratios (P/E ratios). To keep it practical, we'll show how Neways Electronics International N.V.'s (AMS:NEWAY) P/E ratio could help you assess the value on offer. What is Neways Electronics International's P/E ratio? Well, based on the last twelve months it is 11.09. That means that at current prices, buyers pay €11.09 for every €1 in trailing yearly profits.
Check out our latest analysis for Neways Electronics International
How Do I Calculate A Price To Earnings Ratio?
The formula for price to earnings is:
Price to Earnings Ratio = Share Price ÷ Earnings per Share (EPS)
Or for Neways Electronics International:
P/E of 11.09 = €13.5 ÷ €1.22 (Based on the trailing twelve months to December 2018.)
Is A High P/E Ratio Good?
A higher P/E ratio means that investors are paying a higher price for each €1 of company earnings. That is not a good or a bad thing per se, but a high P/E does imply buyers are optimistic about the future.
How Growth Rates Impact P/E Ratios
Earnings growth rates have a big influence on P/E ratios. When earnings grow, the 'E' increases, over time. And in that case, the P/E ratio itself will drop rather quickly. Then, a lower P/E should attract more buyers, pushing the share price up.
Notably, Neways Electronics International grew EPS by a whopping 41% in the last year. And its annual EPS growth rate over 5 years is 45%. With that performance, I would expect it to have an above average P/E ratio.
How Does Neways Electronics International's P/E Ratio Compare To Its Peers?
One good way to get a quick read on what market participants expect of a company is to look at its P/E ratio. If you look at the image below, you can see Neways Electronics International has a lower P/E than the average (17.6) in the electronic industry classification.
Neways Electronics International's P/E tells us that market participants think it will not fare as well as its peers in the same industry. While current expectations are low, the stock could be undervalued if the situation is better than the market assumes. If you consider the stock interesting, further research is recommended. For example, I often monitor director buying and selling.
Remember: P/E Ratios Don't Consider The Balance Sheet
One drawback of using a P/E ratio is that it considers market capitalization, but not the balance sheet. That means it doesn't take debt or cash into account. The exact same company would hypothetically deserve a higher P/E ratio if it had a strong balance sheet, than if it had a weak one with lots of debt, because a cashed up company can spend on growth.
Such expenditure might be good or bad, in the long term, but the point here is that the balance sheet is not reflected by this ratio.
How Does Neways Electronics International's Debt Impact Its P/E Ratio?
Net debt is 26% of Neways Electronics International's market cap. While it's worth keeping this in mind, it isn't a worry.
The Verdict On Neways Electronics International's P/E Ratio
Neways Electronics International has a P/E of 11.1. That's below the average in the NL market, which is 18.5. The company does have a little debt, and EPS growth was good last year. If it continues to grow, then the current low P/E may prove to be unjustified. Since analysts are predicting growth will continue, one might expect to see a higher P/E so it may be worth looking closer.
When the market is wrong about a stock, it gives savvy investors an opportunity. If it is underestimating a company, investors can make money by buying and holding the shares until the market corrects itself. So this free visual report on analyst forecasts could hold the key to an excellent investment decision.
Of course, you might find a fantastic investment by looking at a few good candidates. So take a peek at this free list of companies with modest (or no) debt, trading on a P/E below 20.
We aim to bring you long-term focused research analysis driven by fundamental data. Note that our analysis may not factor in the latest price-sensitive company announcements or qualitative material.
If you spot an error that warrants correction, please contact the editor at editorial-team@simplywallst.com. This article by Simply Wall St is general in nature. It does not constitute a recommendation to buy or sell any stock, and does not take account of your objectives, or your financial situation. Simply Wall St has no position in the stocks mentioned. Thank you for reading.
