What Does Nova Re SIIQ S.p.A.'s (BIT:NR) P/E Ratio Tell You?

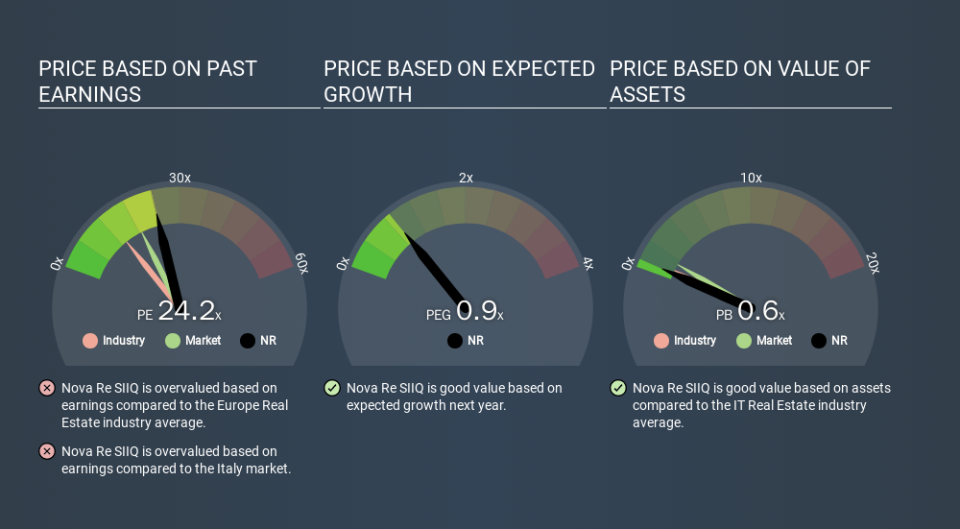
This article is for investors who would like to improve their understanding of price to earnings ratios (P/E ratios). We'll apply a basic P/E ratio analysis to Nova Re SIIQ S.p.A.'s (BIT:NR), to help you decide if the stock is worth further research. Nova Re SIIQ has a P/E ratio of 24.16, based on the last twelve months. In other words, at today's prices, investors are paying €24.16 for every €1 in prior year profit.
View our latest analysis for Nova Re SIIQ
How Do I Calculate A Price To Earnings Ratio?
The formula for P/E is:
Price to Earnings Ratio = Price per Share ÷ Earnings per Share (EPS)
Or for Nova Re SIIQ:
P/E of 24.16 = EUR3.50 ÷ EUR0.14 (Based on the trailing twelve months to June 2019.)
Is A High Price-to-Earnings Ratio Good?
A higher P/E ratio means that investors are paying a higher price for each EUR1 of company earnings. All else being equal, it's better to pay a low price -- but as Warren Buffett said, 'It's far better to buy a wonderful company at a fair price than a fair company at a wonderful price'.
Does Nova Re SIIQ Have A Relatively High Or Low P/E For Its Industry?
The P/E ratio essentially measures market expectations of a company. As you can see below, Nova Re SIIQ has a higher P/E than the average company (13.6) in the real estate industry.
Its relatively high P/E ratio indicates that Nova Re SIIQ shareholders think it will perform better than other companies in its industry classification. Clearly the market expects growth, but it isn't guaranteed. So investors should always consider the P/E ratio alongside other factors, such as whether company directors have been buying shares.
How Growth Rates Impact P/E Ratios
Generally speaking the rate of earnings growth has a profound impact on a company's P/E multiple. Earnings growth means that in the future the 'E' will be higher. That means even if the current P/E is high, it will reduce over time if the share price stays flat. And as that P/E ratio drops, the company will look cheap, unless its share price increases.
Nova Re SIIQ's earnings per share fell by 1.8% in the last twelve months.
A Limitation: P/E Ratios Ignore Debt and Cash In The Bank
It's important to note that the P/E ratio considers the market capitalization, not the enterprise value. Thus, the metric does not reflect cash or debt held by the company. The exact same company would hypothetically deserve a higher P/E ratio if it had a strong balance sheet, than if it had a weak one with lots of debt, because a cashed up company can spend on growth.
Spending on growth might be good or bad a few years later, but the point is that the P/E ratio does not account for the option (or lack thereof).
Is Debt Impacting Nova Re SIIQ's P/E?
Net debt totals a substantial 124% of Nova Re SIIQ's market cap. If you want to compare its P/E ratio to other companies, you must keep in mind that these debt levels would usually warrant a relatively low P/E.
The Verdict On Nova Re SIIQ's P/E Ratio
Nova Re SIIQ has a P/E of 24.2. That's higher than the average in its market, which is 18.7. With relatively high debt, and no earnings per share growth over twelve months, it's safe to say the market believes the company will improve its earnings growth in the future.
When the market is wrong about a stock, it gives savvy investors an opportunity. People often underestimate remarkable growth -- so investors can make money when fast growth is not fully appreciated. So this free visualization of the analyst consensus on future earnings could help you make the right decision about whether to buy, sell, or hold.
But note: Nova Re SIIQ may not be the best stock to buy. So take a peek at this free list of interesting companies with strong recent earnings growth (and a P/E ratio below 20).
If you spot an error that warrants correction, please contact the editor at editorial-team@simplywallst.com. This article by Simply Wall St is general in nature. It does not constitute a recommendation to buy or sell any stock, and does not take account of your objectives, or your financial situation. Simply Wall St has no position in the stocks mentioned.
We aim to bring you long-term focused research analysis driven by fundamental data. Note that our analysis may not factor in the latest price-sensitive company announcements or qualitative material. Thank you for reading.
