Does Olympia Financial Group Inc. (TSE:OLY) Have A Good P/E Ratio?

This article is for investors who would like to improve their understanding of price to earnings ratios (P/E ratios). To keep it practical, we’ll show how Olympia Financial Group Inc.’s (TSE:OLY) P/E ratio could help you assess the value on offer. Olympia Financial Group has a price to earnings ratio of 11.54, based on the last twelve months. In other words, at today’s prices, investors are paying CA$11.54 for every CA$1 in prior year profit.
Check out our latest analysis for Olympia Financial Group
Want to participate in a research study? Help shape the future of investing tools and earn a $60 gift card!
How Do I Calculate A Price To Earnings Ratio?
The formula for price to earnings is:
Price to Earnings Ratio = Share Price ÷ Earnings per Share (EPS)
Or for Olympia Financial Group:
P/E of 11.54 = CA$47.8 ÷ CA$4.14 (Based on the trailing twelve months to December 2018.)
Is A High P/E Ratio Good?
A higher P/E ratio means that investors are paying a higher price for each CA$1 of company earnings. All else being equal, it’s better to pay a low price — but as Warren Buffett said, ‘It’s far better to buy a wonderful company at a fair price than a fair company at a wonderful price.’
How Growth Rates Impact P/E Ratios
P/E ratios primarily reflect market expectations around earnings growth rates. Earnings growth means that in the future the ‘E’ will be higher. That means even if the current P/E is high, it will reduce over time if the share price stays flat. A lower P/E should indicate the stock is cheap relative to others — and that may attract buyers.
Olympia Financial Group increased earnings per share by a whopping 40% last year. And earnings per share have improved by 16% annually, over the last five years. So we’d generally expect it to have a relatively high P/E ratio.
How Does Olympia Financial Group’s P/E Ratio Compare To Its Peers?
The P/E ratio indicates whether the market has higher or lower expectations of a company. The image below shows that Olympia Financial Group has a lower P/E than the average (14.1) P/E for companies in the capital markets industry.
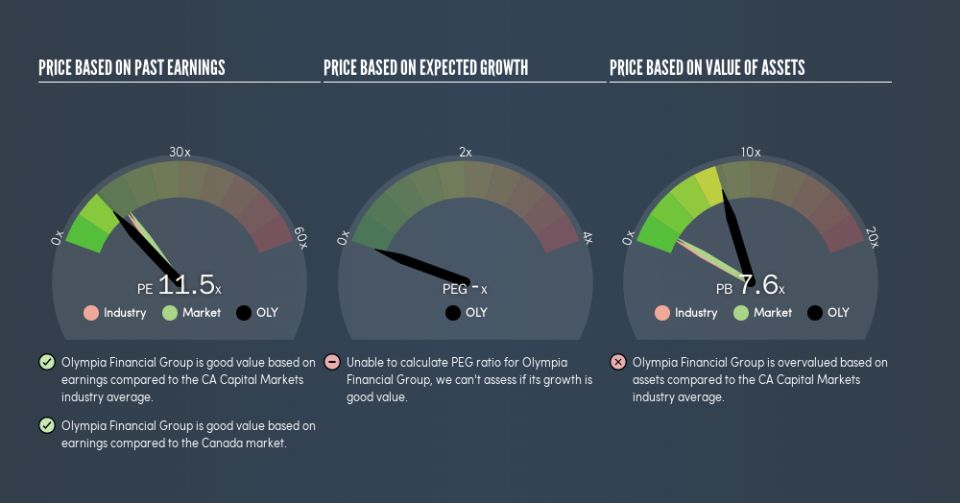
This suggests that market participants think Olympia Financial Group will underperform other companies in its industry. Since the market seems unimpressed with Olympia Financial Group, it’s quite possible it could surprise on the upside. If you consider the stock interesting, further research is recommended. For example, I often monitor director buying and selling.
Don’t Forget: The P/E Does Not Account For Debt or Bank Deposits
Don’t forget that the P/E ratio considers market capitalization. Thus, the metric does not reflect cash or debt held by the company. Theoretically, a business can improve its earnings (and produce a lower P/E in the future), by taking on debt (or spending its remaining cash).
Such expenditure might be good or bad, in the long term, but the point here is that the balance sheet is not reflected by this ratio.
Is Debt Impacting Olympia Financial Group’s P/E?
The extra options and safety that comes with Olympia Financial Group’s CA$8.6m net cash position means that it deserves a higher P/E than it would if it had a lot of net debt.
The Verdict On Olympia Financial Group’s P/E Ratio
Olympia Financial Group’s P/E is 11.5 which is below average (14.9) in the CA market. Not only should the net cash position reduce risk, but the recent growth has been impressive. The below average P/E ratio suggests that market participants don’t believe the strong growth will continue.
Investors should be looking to buy stocks that the market is wrong about. As value investor Benjamin Graham famously said, ‘In the short run, the market is a voting machine but in the long run, it is a weighing machine.’ We don’t have analyst forecasts, but you could get a better understanding of its growth by checking out this more detailed historical graph of earnings, revenue and cash flow.
You might be able to find a better buy than Olympia Financial Group. If you want a selection of possible winners, check out this free list of interesting companies that trade on a P/E below 20 (but have proven they can grow earnings).
We aim to bring you long-term focused research analysis driven by fundamental data. Note that our analysis may not factor in the latest price-sensitive company announcements or qualitative material.
If you spot an error that warrants correction, please contact the editor at editorial-team@simplywallst.com. This article by Simply Wall St is general in nature. It does not constitute a recommendation to buy or sell any stock, and does not take account of your objectives, or your financial situation. Simply Wall St has no position in the stocks mentioned. Thank you for reading.

