Does Omnicom Group's (NYSE:OMC) Share Price Gain of 41% Match Its Business Performance?
We believe investing is smart because history shows that stock markets go higher in the long term. But not every stock you buy will perform as well as the overall market. Unfortunately for shareholders, while the Omnicom Group Inc. (NYSE:OMC) share price is up 41% in the last year, that falls short of the market return. The longer term returns have not been as good, with the stock price only 4.9% higher than it was three years ago.
Check out our latest analysis for Omnicom Group
While markets are a powerful pricing mechanism, share prices reflect investor sentiment, not just underlying business performance. One way to examine how market sentiment has changed over time is to look at the interaction between a company's share price and its earnings per share (EPS).
Over the last twelve months, Omnicom Group actually shrank its EPS by 28%.
Given the share price gain, we doubt the market is measuring progress with EPS. Indeed, when EPS is declining but the share price is up, it often means the market is considering other factors.
Unfortunately Omnicom Group's fell 12% over twelve months. So using a snapshot of key business metrics doesn't give us a good picture of why the market is bidding up the stock.
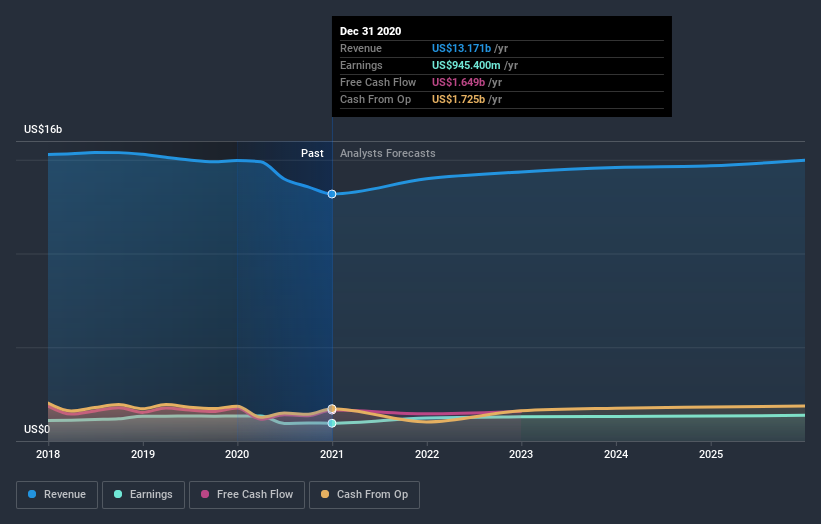
You can see how earnings and revenue have changed over time in the image below (click on the chart to see the exact values).
Omnicom Group is a well known stock, with plenty of analyst coverage, suggesting some visibility into future growth. You can see what analysts are predicting for Omnicom Group in this interactive graph of future profit estimates.
What About Dividends?
As well as measuring the share price return, investors should also consider the total shareholder return (TSR). The TSR incorporates the value of any spin-offs or discounted capital raisings, along with any dividends, based on the assumption that the dividends are reinvested. So for companies that pay a generous dividend, the TSR is often a lot higher than the share price return. We note that for Omnicom Group the TSR over the last year was 48%, which is better than the share price return mentioned above. This is largely a result of its dividend payments!
A Different Perspective
Omnicom Group shareholders are up 48% for the year (even including dividends). But that was short of the market average. The silver lining is that the gain was actually better than the average annual return of 1.9% per year over five year. This could indicate that the company is winning over new investors, as it pursues its strategy. It's always interesting to track share price performance over the longer term. But to understand Omnicom Group better, we need to consider many other factors. For example, we've discovered 1 warning sign for Omnicom Group that you should be aware of before investing here.
If you would prefer to check out another company -- one with potentially superior financials -- then do not miss this free list of companies that have proven they can grow earnings.
Please note, the market returns quoted in this article reflect the market weighted average returns of stocks that currently trade on US exchanges.
This article by Simply Wall St is general in nature. It does not constitute a recommendation to buy or sell any stock, and does not take account of your objectives, or your financial situation. We aim to bring you long-term focused analysis driven by fundamental data. Note that our analysis may not factor in the latest price-sensitive company announcements or qualitative material. Simply Wall St has no position in any stocks mentioned.
Have feedback on this article? Concerned about the content? Get in touch with us directly. Alternatively, email editorial-team (at) simplywallst.com.

