Does Paramount Communications Limited’s (NSE:PARACABLES) ROCE Reflect Well On The Business?

Today we'll evaluate Paramount Communications Limited (NSE:PARACABLES) to determine whether it could have potential as an investment idea. To be precise, we'll consider its Return On Capital Employed (ROCE), as that will inform our view of the quality of the business.
First of all, we'll work out how to calculate ROCE. Next, we'll compare it to others in its industry. Then we'll determine how its current liabilities are affecting its ROCE.
What is Return On Capital Employed (ROCE)?
ROCE measures the amount of pre-tax profits a company can generate from the capital employed in its business. Generally speaking a higher ROCE is better. Ultimately, it is a useful but imperfect metric. Renowned investment researcher Michael Mauboussin has suggested that a high ROCE can indicate that 'one dollar invested in the company generates value of more than one dollar'.
How Do You Calculate Return On Capital Employed?
Analysts use this formula to calculate return on capital employed:
Return on Capital Employed = Earnings Before Interest and Tax (EBIT) ÷ (Total Assets - Current Liabilities)
Or for Paramount Communications:
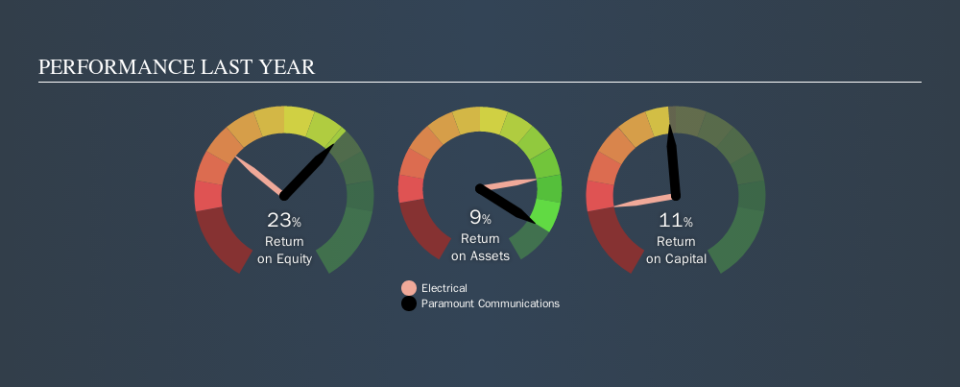
0.11 = ₹388m ÷ (₹4.7b - ₹1.3b) (Based on the trailing twelve months to June 2019.)
So, Paramount Communications has an ROCE of 11%.
View our latest analysis for Paramount Communications
Is Paramount Communications's ROCE Good?
When making comparisons between similar businesses, investors may find ROCE useful. Using our data, Paramount Communications's ROCE appears to be around the 13% average of the Electrical industry. Setting aside the industry comparison for now, Paramount Communications's ROCE is mediocre in absolute terms, considering the risk of investing in stocks versus the safety of a bank account. Investors may wish to consider higher-performing investments.
The image below shows how Paramount Communications's ROCE compares to its industry, and you can click it to see more detail on its past growth.
Remember that this metric is backwards looking - it shows what has happened in the past, and does not accurately predict the future. ROCE can be misleading for companies in cyclical industries, with returns looking impressive during the boom times, but very weak during the busts. ROCE is only a point-in-time measure. How cyclical is Paramount Communications? You can see for yourself by looking at this free graph of past earnings, revenue and cash flow.
How Paramount Communications's Current Liabilities Impact Its ROCE
Current liabilities include invoices, such as supplier payments, short-term debt, or a tax bill, that need to be paid within 12 months. The ROCE equation subtracts current liabilities from capital employed, so a company with a lot of current liabilities appears to have less capital employed, and a higher ROCE than otherwise. To counter this, investors can check if a company has high current liabilities relative to total assets.
Paramount Communications has total assets of ₹4.7b and current liabilities of ₹1.3b. As a result, its current liabilities are equal to approximately 28% of its total assets. It is good to see a restrained amount of current liabilities, as this limits the effect on ROCE.
What We Can Learn From Paramount Communications's ROCE
That said, Paramount Communications's ROCE is mediocre, there may be more attractive investments around. Of course, you might also be able to find a better stock than Paramount Communications. So you may wish to see this free collection of other companies that have grown earnings strongly.
If you like to buy stocks alongside management, then you might just love this free list of companies. (Hint: insiders have been buying them).
We aim to bring you long-term focused research analysis driven by fundamental data. Note that our analysis may not factor in the latest price-sensitive company announcements or qualitative material.
If you spot an error that warrants correction, please contact the editor at editorial-team@simplywallst.com. This article by Simply Wall St is general in nature. It does not constitute a recommendation to buy or sell any stock, and does not take account of your objectives, or your financial situation. Simply Wall St has no position in the stocks mentioned. Thank you for reading.
