Does Pioneer Embroideries Limited’s (NSE:PIONEEREMB) ROCE Reflect Well On The Business?

Today we'll evaluate Pioneer Embroideries Limited (NSE:PIONEEREMB) to determine whether it could have potential as an investment idea. In particular, we'll consider its Return On Capital Employed (ROCE), as that can give us insight into how profitably the company is able to employ capital in its business.
Firstly, we'll go over how we calculate ROCE. Then we'll compare its ROCE to similar companies. Finally, we'll look at how its current liabilities affect its ROCE.
Understanding Return On Capital Employed (ROCE)
ROCE measures the 'return' (pre-tax profit) a company generates from capital employed in its business. All else being equal, a better business will have a higher ROCE. Overall, it is a valuable metric that has its flaws. Renowned investment researcher Michael Mauboussin has suggested that a high ROCE can indicate that 'one dollar invested in the company generates value of more than one dollar'.
So, How Do We Calculate ROCE?
The formula for calculating the return on capital employed is:
Return on Capital Employed = Earnings Before Interest and Tax (EBIT) ÷ (Total Assets - Current Liabilities)
Or for Pioneer Embroideries:
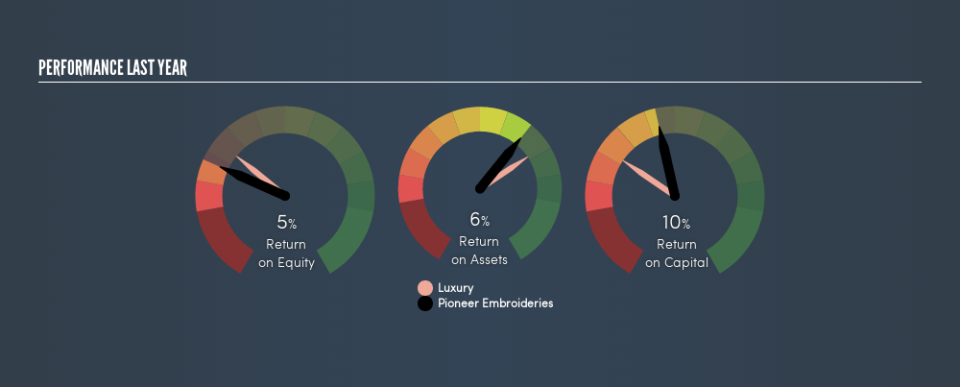
0.10 = ₹110m ÷ (₹2.0b - ₹902m) (Based on the trailing twelve months to June 2019.)
So, Pioneer Embroideries has an ROCE of 10%.
Check out our latest analysis for Pioneer Embroideries
Does Pioneer Embroideries Have A Good ROCE?
When making comparisons between similar businesses, investors may find ROCE useful. Using our data, Pioneer Embroideries's ROCE appears to be around the 12% average of the Luxury industry. Independently of how Pioneer Embroideries compares to its industry, its ROCE in absolute terms is low; especially compared to the ~7.6% available in government bonds. There are potentially more appealing investments elsewhere.
We can see that , Pioneer Embroideries currently has an ROCE of 10% compared to its ROCE 3 years ago, which was 5.3%. This makes us wonder if the company is improving. You can click on the image below to see (in greater detail) how Pioneer Embroideries's past growth compares to other companies.
Remember that this metric is backwards looking - it shows what has happened in the past, and does not accurately predict the future. ROCE can be misleading for companies in cyclical industries, with returns looking impressive during the boom times, but very weak during the busts. ROCE is only a point-in-time measure. If Pioneer Embroideries is cyclical, it could make sense to check out this free graph of past earnings, revenue and cash flow.
How Pioneer Embroideries's Current Liabilities Impact Its ROCE
Short term (or current) liabilities, are things like supplier invoices, overdrafts, or tax bills that need to be paid within 12 months. Due to the way ROCE is calculated, a high level of current liabilities makes a company look as though it has less capital employed, and thus can (sometimes unfairly) boost the ROCE. To counter this, investors can check if a company has high current liabilities relative to total assets.
Pioneer Embroideries has total assets of ₹2.0b and current liabilities of ₹902m. Therefore its current liabilities are equivalent to approximately 46% of its total assets. Pioneer Embroideries has a medium level of current liabilities (boosting the ROCE somewhat), and a low ROCE.
Our Take On Pioneer Embroideries's ROCE
So researching other companies may be a better use of your time. But note: make sure you look for a great company, not just the first idea you come across. So take a peek at this free list of interesting companies with strong recent earnings growth (and a P/E ratio below 20).
I will like Pioneer Embroideries better if I see some big insider buys. While we wait, check out this free list of growing companies with considerable, recent, insider buying.
We aim to bring you long-term focused research analysis driven by fundamental data. Note that our analysis may not factor in the latest price-sensitive company announcements or qualitative material.
If you spot an error that warrants correction, please contact the editor at editorial-team@simplywallst.com. This article by Simply Wall St is general in nature. It does not constitute a recommendation to buy or sell any stock, and does not take account of your objectives, or your financial situation. Simply Wall St has no position in the stocks mentioned. Thank you for reading.
