How Does Qian Hu Corporation Limited's (SGX:BCV) Earnings Growth Stack Up Against Industry Performance?

Analyzing Qian Hu Corporation Limited's (SGX:BCV) track record of past performance is a valuable exercise for investors. It enables us to reflect on whether or not the company has met expectations, which is a powerful signal for future performance. Today I will assess BCV's recent performance announced on 30 June 2019 and compare these figures to its long-term trend and industry movements.
Check out our latest analysis for Qian Hu
How Did BCV's Recent Performance Stack Up Against Its Past?
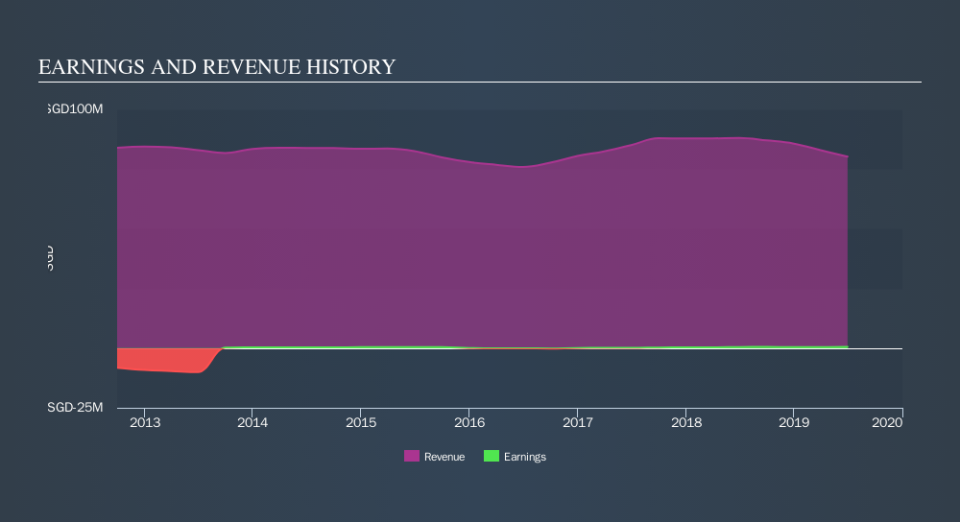
BCV recently turned a profit of S$494k (most recent trailing twelve-months) compared to its average loss of -S$1.1m over the past five years.
In terms of returns from investment, Qian Hu has fallen short of achieving a 20% return on equity (ROE), recording 1.2% instead. Furthermore, its return on assets (ROA) of 1.3% is below the SG Leisure industry of 5.8%, indicating Qian Hu's are utilized less efficiently. However, its return on capital (ROC), which also accounts for Qian Hu’s debt level, has increased over the past 3 years from 1.2% to 2.4%.
What does this mean?
Though Qian Hu's past data is helpful, it is only one aspect of my investment thesis. Positive growth and profitability are what investors like to see in a company’s track record, but how do we properly assess sustainability? I recommend you continue to research Qian Hu to get a better picture of the stock by looking at:
Future Outlook: What are well-informed industry analysts predicting for BCV’s future growth? Take a look at our free research report of analyst consensus for BCV’s outlook.
Financial Health: Are BCV’s operations financially sustainable? Balance sheets can be hard to analyze, which is why we’ve done it for you. Check out our financial health checks here.
Other High-Performing Stocks: Are there other stocks that provide better prospects with proven track records? Explore our free list of these great stocks here.
NB: Figures in this article are calculated using data from the trailing twelve months from 30 June 2019. This may not be consistent with full year annual report figures.
We aim to bring you long-term focused research analysis driven by fundamental data. Note that our analysis may not factor in the latest price-sensitive company announcements or qualitative material.
If you spot an error that warrants correction, please contact the editor at editorial-team@simplywallst.com. This article by Simply Wall St is general in nature. It does not constitute a recommendation to buy or sell any stock, and does not take account of your objectives, or your financial situation. Simply Wall St has no position in the stocks mentioned. Thank you for reading.
