Does Raute Oyj (HEL:RAUTE) Have A Good P/E Ratio?

Want to participate in a short research study? Help shape the future of investing tools and you could win a $250 gift card!
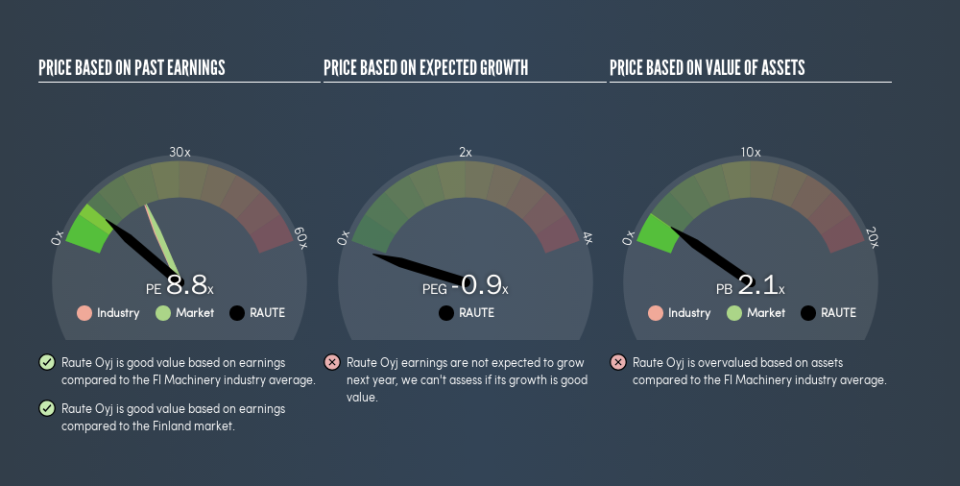
This article is written for those who want to get better at using price to earnings ratios (P/E ratios). We'll look at Raute Oyj's (HEL:RAUTE) P/E ratio and reflect on what it tells us about the company's share price. What is Raute Oyj's P/E ratio? Well, based on the last twelve months it is 8.77. In other words, at today's prices, investors are paying €8.77 for every €1 in prior year profit.
Check out our latest analysis for Raute Oyj
How Do You Calculate A P/E Ratio?
The formula for price to earnings is:
Price to Earnings Ratio = Price per Share ÷ Earnings per Share (EPS)
Or for Raute Oyj:
P/E of 8.77 = €24.1 ÷ €2.75 (Based on the trailing twelve months to March 2019.)
Is A High Price-to-Earnings Ratio Good?
A higher P/E ratio means that buyers have to pay a higher price for each €1 the company has earned over the last year. That isn't a good or a bad thing on its own, but a high P/E means that buyers have a higher opinion of the business's prospects, relative to stocks with a lower P/E.
How Growth Rates Impact P/E Ratios
Earnings growth rates have a big influence on P/E ratios. Earnings growth means that in the future the 'E' will be higher. And in that case, the P/E ratio itself will drop rather quickly. Then, a lower P/E should attract more buyers, pushing the share price up.
Raute Oyj increased earnings per share by a whopping 27% last year. And earnings per share have improved by 20% annually, over the last three years. With that performance, I would expect it to have an above average P/E ratio.
How Does Raute Oyj's P/E Ratio Compare To Its Peers?
The P/E ratio indicates whether the market has higher or lower expectations of a company. The image below shows that Raute Oyj has a lower P/E than the average (19.7) P/E for companies in the machinery industry.
Its relatively low P/E ratio indicates that Raute Oyj shareholders think it will struggle to do as well as other companies in its industry classification. While current expectations are low, the stock could be undervalued if the situation is better than the market assumes. If you consider the stock interesting, further research is recommended. For example, I often monitor director buying and selling.
Don't Forget: The P/E Does Not Account For Debt or Bank Deposits
It's important to note that the P/E ratio considers the market capitalization, not the enterprise value. Thus, the metric does not reflect cash or debt held by the company. In theory, a company can lower its future P/E ratio by using cash or debt to invest in growth.
Spending on growth might be good or bad a few years later, but the point is that the P/E ratio does not account for the option (or lack thereof).
How Does Raute Oyj's Debt Impact Its P/E Ratio?
Raute Oyj has net cash of €12m. This is fairly high at 12% of its market capitalization. That might mean balance sheet strength is important to the business, but should also help push the P/E a bit higher than it would otherwise be.
The Bottom Line On Raute Oyj's P/E Ratio
Raute Oyj has a P/E of 8.8. That's below the average in the FI market, which is 20.1. Not only should the net cash position reduce risk, but the recent growth has been impressive. One might conclude that the market is a bit pessimistic, given the low P/E ratio.
When the market is wrong about a stock, it gives savvy investors an opportunity. As value investor Benjamin Graham famously said, 'In the short run, the market is a voting machine but in the long run, it is a weighing machine.' So this free report on the analyst consensus forecasts could help you make a master move on this stock.
Of course, you might find a fantastic investment by looking at a few good candidates. So take a peek at this free list of companies with modest (or no) debt, trading on a P/E below 20.
We aim to bring you long-term focused research analysis driven by fundamental data. Note that our analysis may not factor in the latest price-sensitive company announcements or qualitative material.
If you spot an error that warrants correction, please contact the editor at editorial-team@simplywallst.com. This article by Simply Wall St is general in nature. It does not constitute a recommendation to buy or sell any stock, and does not take account of your objectives, or your financial situation. Simply Wall St has no position in the stocks mentioned. Thank you for reading.
