How Does Rushil Décor's (NSE:RUSHIL) P/E Compare To Its Industry, After The Share Price Drop?

Unfortunately for some shareholders, the Rushil Décor (NSE:RUSHIL) share price has dived 33% in the last thirty days. And that drop will have no doubt have some shareholders concerned that the 80% share price decline, over the last year, has turned them into bagholders. For those wondering, a bagholder is someone who keeps holding a losing stock indefinitely, without taking the time to consider its prospects carefully, going forward.
All else being equal, a share price drop should make a stock more attractive to potential investors. While the market sentiment towards a stock is very changeable, in the long run, the share price will tend to move in the same direction as earnings per share. So, on certain occasions, long term focussed investors try to take advantage of pessimistic expectations to buy shares at a better price. Perhaps the simplest way to get a read on investors' expectations of a business is to look at its Price to Earnings Ratio (PE Ratio). A high P/E implies that investors have high expectations of what a company can achieve compared to a company with a low P/E ratio.
See our latest analysis for Rushil Décor
How Does Rushil Décor's P/E Ratio Compare To Its Peers?
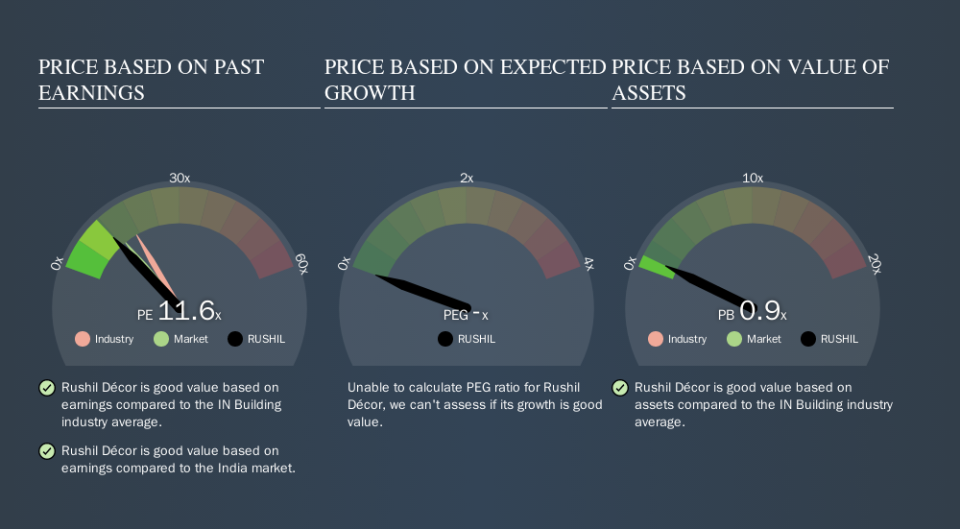
Rushil Décor's P/E of 11.55 indicates relatively low sentiment towards the stock. We can see in the image below that the average P/E (17.0) for companies in the building industry is higher than Rushil Décor's P/E.
Rushil Décor's P/E tells us that market participants think it will not fare as well as its peers in the same industry. Since the market seems unimpressed with Rushil Décor, it's quite possible it could surprise on the upside. If you consider the stock interesting, further research is recommended. For example, I often monitor director buying and selling.
How Growth Rates Impact P/E Ratios
Earnings growth rates have a big influence on P/E ratios. If earnings are growing quickly, then the 'E' in the equation will increase faster than it would otherwise. That means even if the current P/E is high, it will reduce over time if the share price stays flat. And as that P/E ratio drops, the company will look cheap, unless its share price increases.
Rushil Décor's earnings per share fell by 50% in the last twelve months. But EPS is up 42% over the last 5 years.
Remember: P/E Ratios Don't Consider The Balance Sheet
The 'Price' in P/E reflects the market capitalization of the company. So it won't reflect the advantage of cash, or disadvantage of debt. Hypothetically, a company could reduce its future P/E ratio by spending its cash (or taking on debt) to achieve higher earnings.
While growth expenditure doesn't always pay off, the point is that it is a good option to have; but one that the P/E ratio ignores.
How Does Rushil Décor's Debt Impact Its P/E Ratio?
Rushil Décor has net debt worth a very significant 130% of its market capitalization. This is a relatively high level of debt, so the stock probably deserves a relatively low P/E ratio. Keep that in mind when comparing it to other companies.
The Verdict On Rushil Décor's P/E Ratio
Rushil Décor trades on a P/E ratio of 11.6, which is below the IN market average of 13.1. When you consider that the company has significant debt, and didn't grow EPS last year, it isn't surprising that the market has muted expectations. What can be absolutely certain is that the market has become significantly less optimistic about Rushil Décor over the last month, with the P/E ratio falling from 17.2 back then to 11.6 today. For those who prefer to invest with the flow of momentum, that might be a bad sign, but for a contrarian, it may signal opportunity.
Investors should be looking to buy stocks that the market is wrong about. If the reality for a company is not as bad as the P/E ratio indicates, then the share price should increase as the market realizes this. We don't have analyst forecasts, but shareholders might want to examine this detailed historical graph of earnings, revenue and cash flow.
Of course, you might find a fantastic investment by looking at a few good candidates. So take a peek at this free list of companies with modest (or no) debt, trading on a P/E below 20.
We aim to bring you long-term focused research analysis driven by fundamental data. Note that our analysis may not factor in the latest price-sensitive company announcements or qualitative material.
If you spot an error that warrants correction, please contact the editor at editorial-team@simplywallst.com. This article by Simply Wall St is general in nature. It does not constitute a recommendation to buy or sell any stock, and does not take account of your objectives, or your financial situation. Simply Wall St has no position in the stocks mentioned. Thank you for reading.
