What Does Sa Sa International Holdings Limited's (HKG:178) P/E Ratio Tell You?

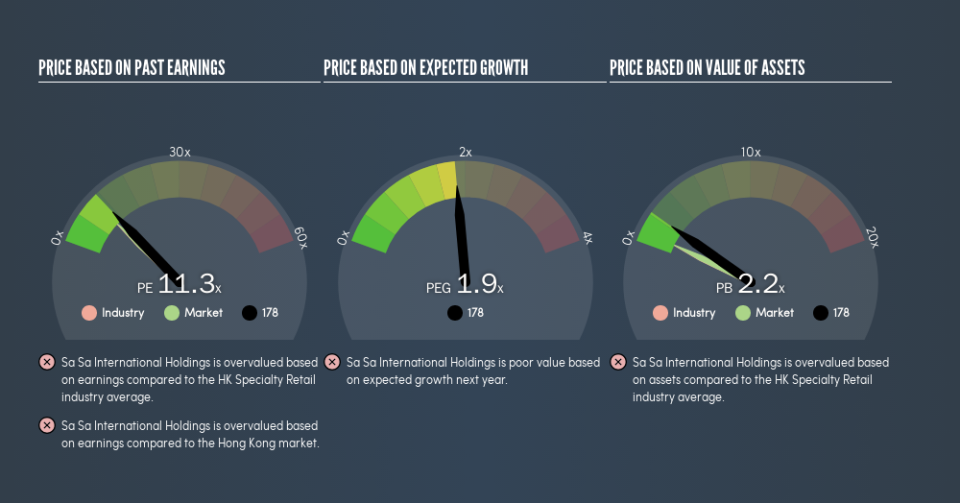
The goal of this article is to teach you how to use price to earnings ratios (P/E ratios). We'll apply a basic P/E ratio analysis to Sa Sa International Holdings Limited's (HKG:178), to help you decide if the stock is worth further research. Looking at earnings over the last twelve months, Sa Sa International Holdings has a P/E ratio of 11.35. That is equivalent to an earnings yield of about 8.8%.
Check out our latest analysis for Sa Sa International Holdings
How Do I Calculate A Price To Earnings Ratio?
The formula for price to earnings is:
Price to Earnings Ratio = Price per Share ÷ Earnings per Share (EPS)
Or for Sa Sa International Holdings:
P/E of 11.35 = HK$1.75 ÷ HK$0.15 (Based on the trailing twelve months to March 2019.)
Is A High Price-to-Earnings Ratio Good?
A higher P/E ratio implies that investors pay a higher price for the earning power of the business. That isn't a good or a bad thing on its own, but a high P/E means that buyers have a higher opinion of the business's prospects, relative to stocks with a lower P/E.
How Does Sa Sa International Holdings's P/E Ratio Compare To Its Peers?
The P/E ratio essentially measures market expectations of a company. As you can see below, Sa Sa International Holdings has a higher P/E than the average company (9.8) in the specialty retail industry.
Sa Sa International Holdings's P/E tells us that market participants think the company will perform better than its industry peers, going forward. The market is optimistic about the future, but that doesn't guarantee future growth. So further research is always essential. I often monitor director buying and selling.
How Growth Rates Impact P/E Ratios
Generally speaking the rate of earnings growth has a profound impact on a company's P/E multiple. If earnings are growing quickly, then the 'E' in the equation will increase faster than it would otherwise. That means even if the current P/E is high, it will reduce over time if the share price stays flat. A lower P/E should indicate the stock is cheap relative to others -- and that may attract buyers.
Sa Sa International Holdings's earnings per share were pretty steady over the last year. But over the longer term (3 years), earnings per share have increased by 4.7%. And EPS is down 14% a year, over the last 5 years. So it would be surprising to see a high P/E.
Don't Forget: The P/E Does Not Account For Debt or Bank Deposits
One drawback of using a P/E ratio is that it considers market capitalization, but not the balance sheet. Thus, the metric does not reflect cash or debt held by the company. In theory, a company can lower its future P/E ratio by using cash or debt to invest in growth.
Spending on growth might be good or bad a few years later, but the point is that the P/E ratio does not account for the option (or lack thereof).
So What Does Sa Sa International Holdings's Balance Sheet Tell Us?
With net cash of HK$1.1b, Sa Sa International Holdings has a very strong balance sheet, which may be important for its business. Having said that, at 21% of its market capitalization the cash hoard would contribute towards a higher P/E ratio.
The Bottom Line On Sa Sa International Holdings's P/E Ratio
Sa Sa International Holdings's P/E is 11.3 which is above average (9.9) in its market. The recent drop in earnings per share might keep value investors away, but the relatively strong balance sheet will allow the company time to invest in growth. Clearly, the high P/E indicates shareholders think it will!
When the market is wrong about a stock, it gives savvy investors an opportunity. People often underestimate remarkable growth -- so investors can make money when fast growth is not fully appreciated. So this free visualization of the analyst consensus on future earnings could help you make the right decision about whether to buy, sell, or hold.
But note: Sa Sa International Holdings may not be the best stock to buy. So take a peek at this free list of interesting companies with strong recent earnings growth (and a P/E ratio below 20).
We aim to bring you long-term focused research analysis driven by fundamental data. Note that our analysis may not factor in the latest price-sensitive company announcements or qualitative material.
If you spot an error that warrants correction, please contact the editor at editorial-team@simplywallst.com. This article by Simply Wall St is general in nature. It does not constitute a recommendation to buy or sell any stock, and does not take account of your objectives, or your financial situation. Simply Wall St has no position in the stocks mentioned. Thank you for reading.
