How Does Security National Financial's (NASDAQ:SNFC.A) P/E Compare To Its Industry, After Its Big Share Price Gain?

Security National Financial (NASDAQ:SNFC.A) shareholders are no doubt pleased to see that the share price has bounced 32% in the last month alone, although it is still down 15% over the last quarter. Unfortunately, the full year gain of 3.1% wasn't so sweet.
All else being equal, a sharp share price increase should make a stock less attractive to potential investors. In the long term, share prices tend to follow earnings per share, but in the short term prices bounce around in response to short term factors (which are not always obvious). The implication here is that deep value investors might steer clear when expectations of a company are too high. Perhaps the simplest way to get a read on investors' expectations of a business is to look at its Price to Earnings Ratio (PE Ratio). Investors have optimistic expectations of companies with higher P/E ratios, compared to companies with lower P/E ratios.
View our latest analysis for Security National Financial
How Does Security National Financial's P/E Ratio Compare To Its Peers?
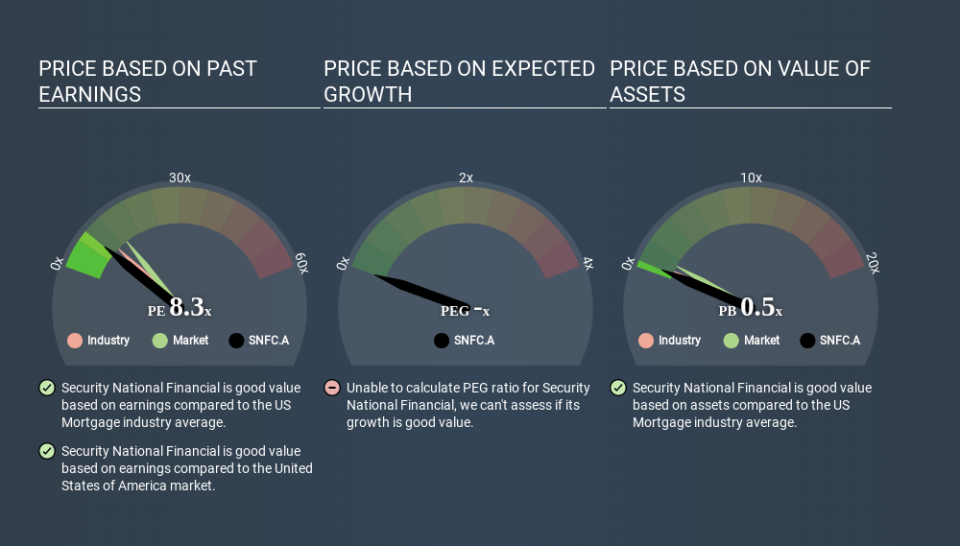
We can tell from its P/E ratio of 8.26 that sentiment around Security National Financial isn't particularly high. If you look at the image below, you can see Security National Financial has a lower P/E than the average (10.4) in the mortgage industry classification.
Its relatively low P/E ratio indicates that Security National Financial shareholders think it will struggle to do as well as other companies in its industry classification. Since the market seems unimpressed with Security National Financial, it's quite possible it could surprise on the upside. It is arguably worth checking if insiders are buying shares, because that might imply they believe the stock is undervalued.
How Growth Rates Impact P/E Ratios
Companies that shrink earnings per share quickly will rapidly decrease the 'E' in the equation. That means unless the share price falls, the P/E will increase in a few years. A higher P/E should indicate the stock is expensive relative to others -- and that may encourage shareholders to sell.
Security National Financial saw earnings per share decrease by 50% last year. But it has grown its earnings per share by 3.3% per year over the last five years. And EPS is down 5.4% a year, over the last 3 years. This might lead to low expectations.
Remember: P/E Ratios Don't Consider The Balance Sheet
One drawback of using a P/E ratio is that it considers market capitalization, but not the balance sheet. Thus, the metric does not reflect cash or debt held by the company. In theory, a company can lower its future P/E ratio by using cash or debt to invest in growth.
Such expenditure might be good or bad, in the long term, but the point here is that the balance sheet is not reflected by this ratio.
Security National Financial's Balance Sheet
Security National Financial's net debt is 98% of its market cap. This is enough debt that you'd have to make some adjustments before using the P/E ratio to compare it to a company with net cash.
The Bottom Line On Security National Financial's P/E Ratio
Security National Financial trades on a P/E ratio of 8.3, which is below the US market average of 13.5. When you consider that the company has significant debt, and didn't grow EPS last year, it isn't surprising that the market has muted expectations. What we know for sure is that investors are becoming less uncomfortable about Security National Financial's prospects, since they have pushed its P/E ratio from 6.2 to 8.3 over the last month. If you like to buy stocks that could be turnaround opportunities, then this one might be a candidate; but if you're more sensitive to price, then you may feel the opportunity has passed.
When the market is wrong about a stock, it gives savvy investors an opportunity. If it is underestimating a company, investors can make money by buying and holding the shares until the market corrects itself. We don't have analyst forecasts, but you could get a better understanding of its growth by checking out this more detailed historical graph of earnings, revenue and cash flow.
Of course, you might find a fantastic investment by looking at a few good candidates. So take a peek at this free list of companies with modest (or no) debt, trading on a P/E below 20.
If you spot an error that warrants correction, please contact the editor at editorial-team@simplywallst.com. This article by Simply Wall St is general in nature. It does not constitute a recommendation to buy or sell any stock, and does not take account of your objectives, or your financial situation. Simply Wall St has no position in the stocks mentioned.
We aim to bring you long-term focused research analysis driven by fundamental data. Note that our analysis may not factor in the latest price-sensitive company announcements or qualitative material. Thank you for reading.
