How Does Southern Missouri Bancorp's (NASDAQ:SMBC) P/E Compare To Its Industry, After The Share Price Drop?

To the annoyance of some shareholders, Southern Missouri Bancorp (NASDAQ:SMBC) shares are down a considerable 32% in the last month. The recent drop has obliterated the annual return, with the share price now down 25% over that longer period.
Assuming nothing else has changed, a lower share price makes a stock more attractive to potential buyers. In the long term, share prices tend to follow earnings per share, but in the short term prices bounce around in response to short term factors (which are not always obvious). So, on certain occasions, long term focussed investors try to take advantage of pessimistic expectations to buy shares at a better price. Perhaps the simplest way to get a read on investors' expectations of a business is to look at its Price to Earnings Ratio (PE Ratio). A high P/E ratio means that investors have a high expectation about future growth, while a low P/E ratio means they have low expectations about future growth.
See our latest analysis for Southern Missouri Bancorp
How Does Southern Missouri Bancorp's P/E Ratio Compare To Its Peers?
We can tell from its P/E ratio of 7.21 that sentiment around Southern Missouri Bancorp isn't particularly high. If you look at the image below, you can see Southern Missouri Bancorp has a lower P/E than the average (10.5) in the mortgage industry classification.
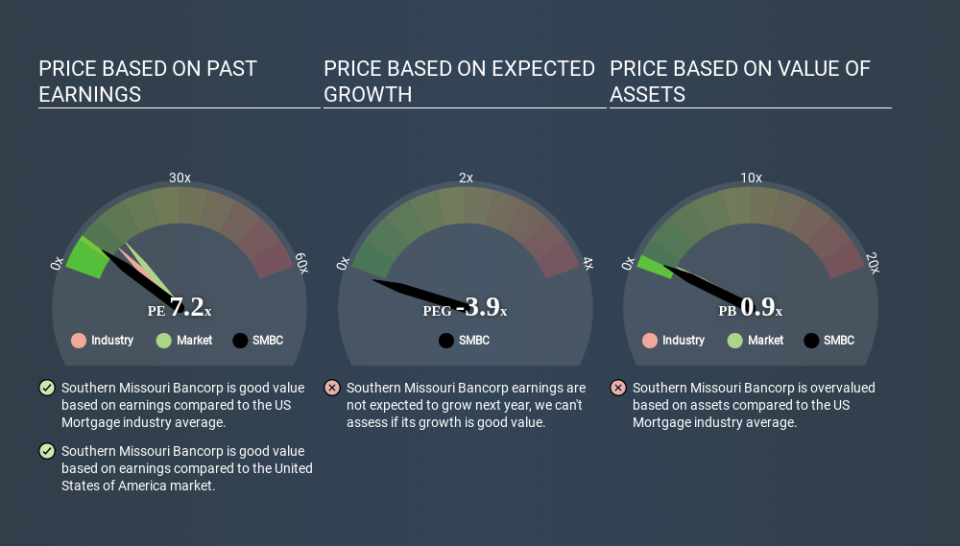
This suggests that market participants think Southern Missouri Bancorp will underperform other companies in its industry. Many investors like to buy stocks when the market is pessimistic about their prospects. If you consider the stock interesting, further research is recommended. For example, I often monitor director buying and selling.
How Growth Rates Impact P/E Ratios
Earnings growth rates have a big influence on P/E ratios. Earnings growth means that in the future the 'E' will be higher. That means unless the share price increases, the P/E will reduce in a few years. And as that P/E ratio drops, the company will look cheap, unless its share price increases.
It's great to see that Southern Missouri Bancorp grew EPS by 16% in the last year. And earnings per share have improved by 14% annually, over the last five years. With that performance, you might expect an above average P/E ratio.
Remember: P/E Ratios Don't Consider The Balance Sheet
One drawback of using a P/E ratio is that it considers market capitalization, but not the balance sheet. In other words, it does not consider any debt or cash that the company may have on the balance sheet. In theory, a company can lower its future P/E ratio by using cash or debt to invest in growth.
Spending on growth might be good or bad a few years later, but the point is that the P/E ratio does not account for the option (or lack thereof).
How Does Southern Missouri Bancorp's Debt Impact Its P/E Ratio?
Southern Missouri Bancorp has net debt equal to 41% of its market cap. You'd want to be aware of this fact, but it doesn't bother us.
The Verdict On Southern Missouri Bancorp's P/E Ratio
Southern Missouri Bancorp trades on a P/E ratio of 7.2, which is below the US market average of 13.1. The company hasn't stretched its balance sheet, and earnings growth was good last year. If it continues to grow, then the current low P/E may prove to be unjustified. Given Southern Missouri Bancorp's P/E ratio has declined from 10.6 to 7.2 in the last month, we know for sure that the market is more worried about the business today, than it was back then. For those who prefer to invest with the flow of momentum, that might be a bad sign, but for deep value investors this stock might justify some research.
Investors should be looking to buy stocks that the market is wrong about. As value investor Benjamin Graham famously said, 'In the short run, the market is a voting machine but in the long run, it is a weighing machine. So this free visual report on analyst forecasts could hold the key to an excellent investment decision.
Of course, you might find a fantastic investment by looking at a few good candidates. So take a peek at this free list of companies with modest (or no) debt, trading on a P/E below 20.
If you spot an error that warrants correction, please contact the editor at editorial-team@simplywallst.com. This article by Simply Wall St is general in nature. It does not constitute a recommendation to buy or sell any stock, and does not take account of your objectives, or your financial situation. Simply Wall St has no position in the stocks mentioned.
We aim to bring you long-term focused research analysis driven by fundamental data. Note that our analysis may not factor in the latest price-sensitive company announcements or qualitative material. Thank you for reading.
