What Does Suprajit Engineering Limited’s (NSE:SUPRAJIT) P/E Ratio Tell You?

This article is written for those who want to get better at using price to earnings ratios (P/E ratios). We’ll look at Suprajit Engineering Limited’s (NSE:SUPRAJIT) P/E ratio and reflect on what it tells us about the company’s share price. Suprajit Engineering has a P/E ratio of 18.52, based on the last twelve months. In other words, at today’s prices, investors are paying ₹18.52 for every ₹1 in prior year profit.
See our latest analysis for Suprajit Engineering
How Do You Calculate Suprajit Engineering’s P/E Ratio?
The formula for price to earnings is:
Price to Earnings Ratio = Share Price ÷ Earnings per Share (EPS)
Or for Suprajit Engineering:
P/E of 18.52 = ₹196.5 ÷ ₹10.61 (Based on the year to December 2018.)
Is A High Price-to-Earnings Ratio Good?
A higher P/E ratio implies that investors pay a higher price for the earning power of the business. All else being equal, it’s better to pay a low price — but as Warren Buffett said, ‘It’s far better to buy a wonderful company at a fair price than a fair company at a wonderful price.’
How Growth Rates Impact P/E Ratios
P/E ratios primarily reflect market expectations around earnings growth rates. Earnings growth means that in the future the ‘E’ will be higher. That means unless the share price increases, the P/E will reduce in a few years. So while a stock may look expensive based on past earnings, it could be cheap based on future earnings.
Most would be impressed by Suprajit Engineering earnings growth of 19% in the last year. And earnings per share have improved by 22% annually, over the last five years. With that performance, you might expect an above average P/E ratio.
How Does Suprajit Engineering’s P/E Ratio Compare To Its Peers?
The P/E ratio essentially measures market expectations of a company. You can see in the image below that the average P/E (16) for companies in the auto components industry is lower than Suprajit Engineering’s P/E.
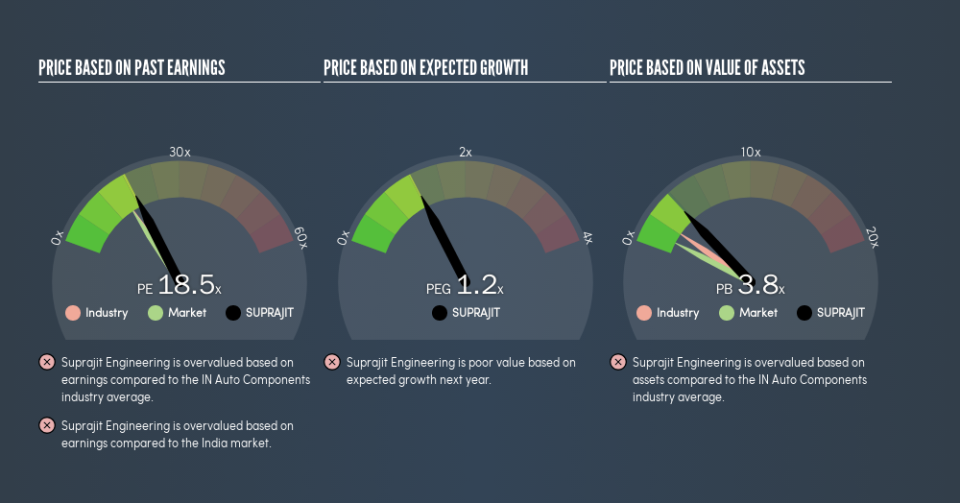
That means that the market expects Suprajit Engineering will outperform other companies in its industry. The market is optimistic about the future, but that doesn’t guarantee future growth. So investors should always consider the P/E ratio alongside other factors, such as whether company directors have been buying shares.
Remember: P/E Ratios Don’t Consider The Balance Sheet
The ‘Price’ in P/E reflects the market capitalization of the company. Thus, the metric does not reflect cash or debt held by the company. In theory, a company can lower its future P/E ratio by using cash or debt to invest in growth.
Such spending might be good or bad, overall, but the key point here is that you need to look at debt to understand the P/E ratio in context.
Suprajit Engineering’s Balance Sheet
Suprajit Engineering’s net debt is 7.5% of its market cap. The market might award it a higher P/E ratio if it had net cash, but its unlikely this low level of net borrowing is having a big impact on the P/E multiple.
The Bottom Line On Suprajit Engineering’s P/E Ratio
Suprajit Engineering trades on a P/E ratio of 18.5, which is above the IN market average of 15.8. The company is not overly constrained by its modest debt levels, and it is growing earnings per share. So it is not surprising the market is probably extrapolating recent growth well into the future, reflected in the relatively high P/E ratio.
Investors should be looking to buy stocks that the market is wrong about. As value investor Benjamin Graham famously said, ‘In the short run, the market is a voting machine but in the long run, it is a weighing machine.’ So this free report on the analyst consensus forecasts could help you make a master move on this stock.
Of course, you might find a fantastic investment by looking at a few good candidates. So take a peek at this free list of companies with modest (or no) debt, trading on a P/E below 20.
We aim to bring you long-term focused research analysis driven by fundamental data. Note that our analysis may not factor in the latest price-sensitive company announcements or qualitative material.
If you spot an error that warrants correction, please contact the editor at editorial-team@simplywallst.com. This article by Simply Wall St is general in nature. It does not constitute a recommendation to buy or sell any stock, and does not take account of your objectives, or your financial situation. Simply Wall St has no position in the stocks mentioned. Thank you for reading.
