Does Sureserve Group plc's (LON:SUR) P/E Ratio Signal A Buying Opportunity?

Want to participate in a short research study? Help shape the future of investing tools and you could win a $250 gift card!
Today, we'll introduce the concept of the P/E ratio for those who are learning about investing. We'll apply a basic P/E ratio analysis to Sureserve Group plc's (LON:SUR), to help you decide if the stock is worth further research. What is Sureserve Group's P/E ratio? Well, based on the last twelve months it is 18.62. That corresponds to an earnings yield of approximately 5.4%.
See our latest analysis for Sureserve Group
How Do You Calculate A P/E Ratio?
The formula for price to earnings is:
Price to Earnings Ratio = Share Price ÷ Earnings per Share (EPS)
Or for Sureserve Group:
P/E of 18.62 = £0.29 ÷ £0.016 (Based on the year to March 2019.)
Is A High Price-to-Earnings Ratio Good?
A higher P/E ratio means that buyers have to pay a higher price for each £1 the company has earned over the last year. That isn't a good or a bad thing on its own, but a high P/E means that buyers have a higher opinion of the business's prospects, relative to stocks with a lower P/E.
How Growth Rates Impact P/E Ratios
Probably the most important factor in determining what P/E a company trades on is the earnings growth. If earnings are growing quickly, then the 'E' in the equation will increase faster than it would otherwise. And in that case, the P/E ratio itself will drop rather quickly. So while a stock may look expensive based on past earnings, it could be cheap based on future earnings.
Sureserve Group's 95% EPS improvement over the last year was like bamboo growth after rain; rapid and impressive. Even better, EPS is up 131% per year over three years. So you might say it really deserves to have an above-average P/E ratio.
Does Sureserve Group Have A Relatively High Or Low P/E For Its Industry?
The P/E ratio indicates whether the market has higher or lower expectations of a company. The image below shows that Sureserve Group has a P/E ratio that is roughly in line with the commercial services industry average (18.6).
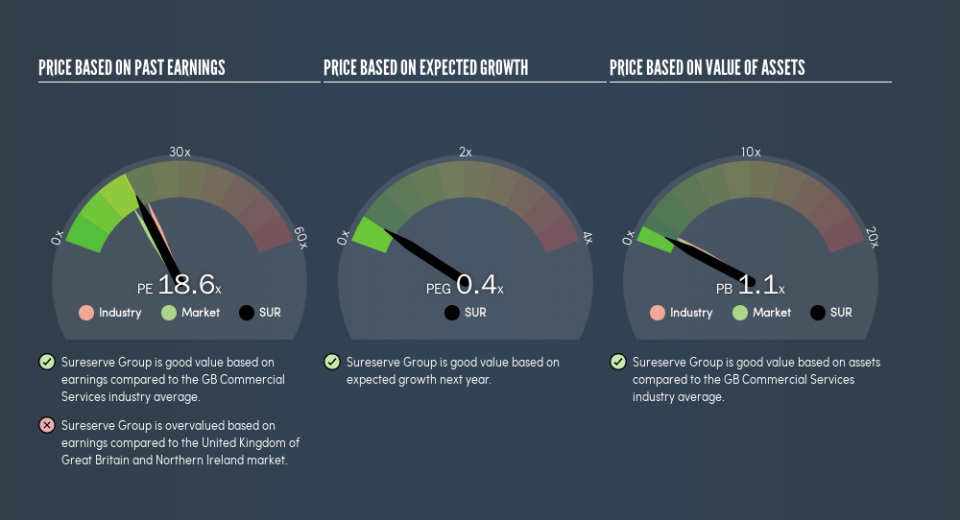
Its P/E ratio suggests that Sureserve Group shareholders think that in the future it will perform about the same as other companies in its industry classification. If the company has better than average prospects, then the market might be underestimating it. I would further inform my view by checking insider buying and selling., among other things.
Don't Forget: The P/E Does Not Account For Debt or Bank Deposits
One drawback of using a P/E ratio is that it considers market capitalization, but not the balance sheet. That means it doesn't take debt or cash into account. Theoretically, a business can improve its earnings (and produce a lower P/E in the future) by investing in growth. That means taking on debt (or spending its cash).
While growth expenditure doesn't always pay off, the point is that it is a good option to have; but one that the P/E ratio ignores.
How Does Sureserve Group's Debt Impact Its P/E Ratio?
Net debt is 28% of Sureserve Group's market cap. While that's enough to warrant consideration, it doesn't really concern us.
The Bottom Line On Sureserve Group's P/E Ratio
Sureserve Group trades on a P/E ratio of 18.6, which is above the GB market average of 16.3. Its debt levels do not imperil its balance sheet and its EPS growth is very healthy indeed. So on this analysis a high P/E ratio seems reasonable.
When the market is wrong about a stock, it gives savvy investors an opportunity. People often underestimate remarkable growth -- so investors can make money when fast growth is not fully appreciated. So this free report on the analyst consensus forecasts could help you make a master move on this stock.
Of course you might be able to find a better stock than Sureserve Group. So you may wish to see this free collection of other companies that have grown earnings strongly.
We aim to bring you long-term focused research analysis driven by fundamental data. Note that our analysis may not factor in the latest price-sensitive company announcements or qualitative material.
If you spot an error that warrants correction, please contact the editor at editorial-team@simplywallst.com. This article by Simply Wall St is general in nature. It does not constitute a recommendation to buy or sell any stock, and does not take account of your objectives, or your financial situation. Simply Wall St has no position in the stocks mentioned. Thank you for reading.
