Does Taro Pharmaceutical Industries Ltd. (NYSE:TARO) Have A Good P/E Ratio?

Want to participate in a short research study? Help shape the future of investing tools and you could win a $250 gift card!
Today, we'll introduce the concept of the P/E ratio for those who are learning about investing. We'll look at Taro Pharmaceutical Industries Ltd.'s (NYSE:TARO) P/E ratio and reflect on what it tells us about the company's share price. Taro Pharmaceutical Industries has a P/E ratio of 13.53, based on the last twelve months. In other words, at today's prices, investors are paying $13.53 for every $1 in prior year profit.
View our latest analysis for Taro Pharmaceutical Industries
How Do You Calculate A P/E Ratio?
The formula for P/E is:
Price to Earnings Ratio = Price per Share ÷ Earnings per Share (EPS)
Or for Taro Pharmaceutical Industries:
P/E of 13.53 = $106.66 ÷ $7.88 (Based on the year to December 2018.)
Is A High Price-to-Earnings Ratio Good?
A higher P/E ratio means that buyers have to pay a higher price for each $1 the company has earned over the last year. That isn't a good or a bad thing on its own, but a high P/E means that buyers have a higher opinion of the business's prospects, relative to stocks with a lower P/E.
How Growth Rates Impact P/E Ratios
If earnings fall then in the future the 'E' will be lower. That means unless the share price falls, the P/E will increase in a few years. A higher P/E should indicate the stock is expensive relative to others -- and that may encourage shareholders to sell.
In the last year, Taro Pharmaceutical Industries grew EPS like Taylor Swift grew her fan base back in 2010; the 53% gain was both fast and well deserved. On the other hand, the longer term performance is poor, with EPS down -1.9% per year over 3 years.
How Does Taro Pharmaceutical Industries's P/E Ratio Compare To Its Peers?
The P/E ratio indicates whether the market has higher or lower expectations of a company. If you look at the image below, you can see Taro Pharmaceutical Industries has a lower P/E than the average (20.4) in the pharmaceuticals industry classification.
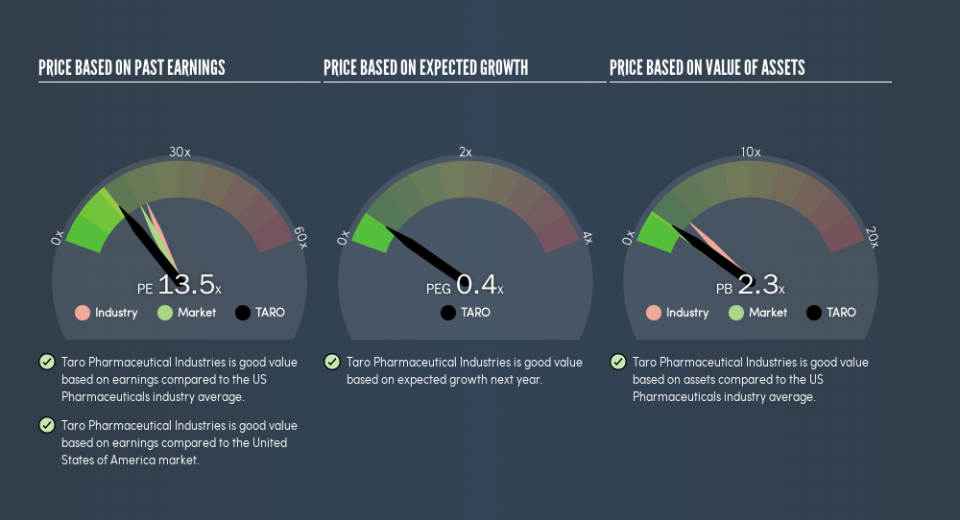
Its relatively low P/E ratio indicates that Taro Pharmaceutical Industries shareholders think it will struggle to do as well as other companies in its industry classification. Since the market seems unimpressed with Taro Pharmaceutical Industries, it's quite possible it could surprise on the upside. You should delve deeper. I like to check if company insiders have been buying or selling.
A Limitation: P/E Ratios Ignore Debt and Cash In The Bank
Don't forget that the P/E ratio considers market capitalization. That means it doesn't take debt or cash into account. Hypothetically, a company could reduce its future P/E ratio by spending its cash (or taking on debt) to achieve higher earnings.
Spending on growth might be good or bad a few years later, but the point is that the P/E ratio does not account for the option (or lack thereof).
So What Does Taro Pharmaceutical Industries's Balance Sheet Tell Us?
With net cash of US$1.1b, Taro Pharmaceutical Industries has a very strong balance sheet, which may be important for its business. Having said that, at 25% of its market capitalization the cash hoard would contribute towards a higher P/E ratio.
The Bottom Line On Taro Pharmaceutical Industries's P/E Ratio
Taro Pharmaceutical Industries has a P/E of 13.5. That's below the average in the US market, which is 18.4. It grew its EPS nicely over the last year, and the healthy balance sheet implies there is more potential for growth. The relatively low P/E ratio implies the market is pessimistic. Given analysts are expecting further growth, one I would have expected a higher P/E ratio. So this stock may well be worth further research.
Investors have an opportunity when market expectations about a stock are wrong. If the reality for a company is not as bad as the P/E ratio indicates, then the share price should increase as the market realizes this. So this free report on the analyst consensus forecasts could help you make a master move on this stock.
Of course, you might find a fantastic investment by looking at a few good candidates. So take a peek at this free list of companies with modest (or no) debt, trading on a P/E below 20.
We aim to bring you long-term focused research analysis driven by fundamental data. Note that our analysis may not factor in the latest price-sensitive company announcements or qualitative material.
If you spot an error that warrants correction, please contact the editor at editorial-team@simplywallst.com. This article by Simply Wall St is general in nature. It does not constitute a recommendation to buy or sell any stock, and does not take account of your objectives, or your financial situation. Simply Wall St has no position in the stocks mentioned. Thank you for reading.
