How Does Tiong Woon Corporation Holding's (SGX:BQM) P/E Compare To Its Industry, After Its Big Share Price Gain?

It's really great to see that even after a strong run, Tiong Woon Corporation Holding (SGX:BQM) shares have been powering on, with a gain of 39% in the last thirty days. Looking back a bit further, we're also happy to report the stock is up 79% in the last year.
All else being equal, a sharp share price increase should make a stock less attractive to potential investors. In the long term, share prices tend to follow earnings per share, but in the short term prices bounce around in response to short term factors (which are not always obvious). So some would prefer to hold off buying when there is a lot of optimism towards a stock. Perhaps the simplest way to get a read on investors' expectations of a business is to look at its Price to Earnings Ratio (PE Ratio). A high P/E implies that investors have high expectations of what a company can achieve compared to a company with a low P/E ratio.
View our latest analysis for Tiong Woon Corporation Holding
How Does Tiong Woon Corporation Holding's P/E Ratio Compare To Its Peers?
Tiong Woon Corporation Holding has a P/E ratio of 17.04. You can see in the image below that the average P/E (16.0) for companies in the commercial services industry is roughly the same as Tiong Woon Corporation Holding's P/E.
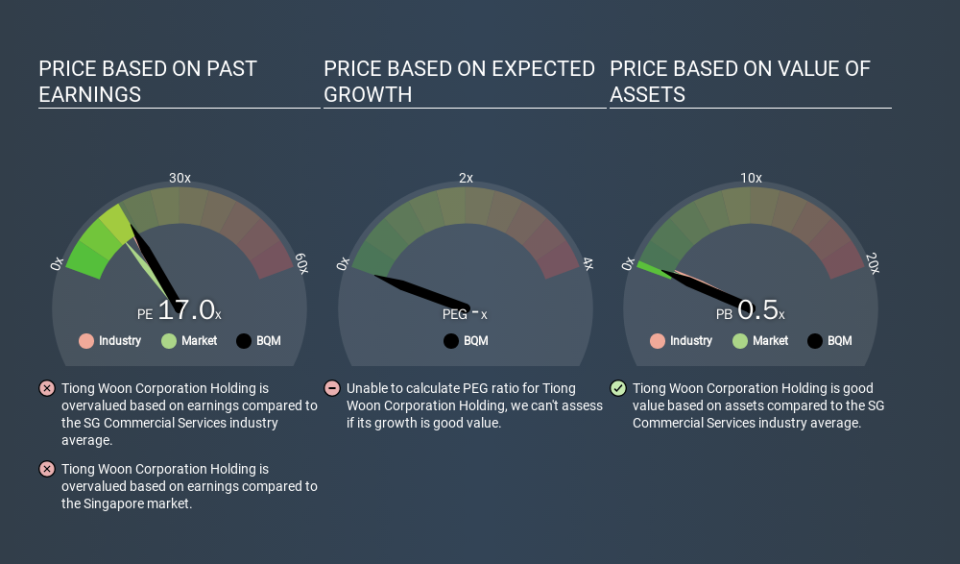
That indicates that the market expects Tiong Woon Corporation Holding will perform roughly in line with other companies in its industry. So if Tiong Woon Corporation Holding actually outperforms its peers going forward, that should be a positive for the share price. Checking factors such as director buying and selling. could help you form your own view on if that will happen.
How Growth Rates Impact P/E Ratios
Probably the most important factor in determining what P/E a company trades on is the earnings growth. That's because companies that grow earnings per share quickly will rapidly increase the 'E' in the equation. And in that case, the P/E ratio itself will drop rather quickly. Then, a lower P/E should attract more buyers, pushing the share price up.
Tiong Woon Corporation Holding's 79% EPS improvement over the last year was like bamboo growth after rain; rapid and impressive. Regrettably, the longer term performance is poor, with EPS down 17% per year over 5 years.
Don't Forget: The P/E Does Not Account For Debt or Bank Deposits
Don't forget that the P/E ratio considers market capitalization. Thus, the metric does not reflect cash or debt held by the company. Hypothetically, a company could reduce its future P/E ratio by spending its cash (or taking on debt) to achieve higher earnings.
While growth expenditure doesn't always pay off, the point is that it is a good option to have; but one that the P/E ratio ignores.
How Does Tiong Woon Corporation Holding's Debt Impact Its P/E Ratio?
Tiong Woon Corporation Holding has net debt equal to 38% of its market cap. While it's worth keeping this in mind, it isn't a worry.
The Bottom Line On Tiong Woon Corporation Holding's P/E Ratio
Tiong Woon Corporation Holding has a P/E of 17.0. That's higher than the average in its market, which is 13.2. Its debt levels do not imperil its balance sheet and its EPS growth is very healthy indeed. So on this analysis a high P/E ratio seems reasonable. What we know for sure is that investors have become more excited about Tiong Woon Corporation Holding recently, since they have pushed its P/E ratio from 12.3 to 17.0 over the last month. For those who prefer to invest with the flow of momentum, that might mean it's time to put the stock on a watchlist, or research it. But the contrarian may see it as a missed opportunity.
Investors should be looking to buy stocks that the market is wrong about. As value investor Benjamin Graham famously said, 'In the short run, the market is a voting machine but in the long run, it is a weighing machine. We don't have analyst forecasts, but shareholders might want to examine this detailed historical graph of earnings, revenue and cash flow.
Of course you might be able to find a better stock than Tiong Woon Corporation Holding. So you may wish to see this free collection of other companies that have grown earnings strongly.
If you spot an error that warrants correction, please contact the editor at editorial-team@simplywallst.com. This article by Simply Wall St is general in nature. It does not constitute a recommendation to buy or sell any stock, and does not take account of your objectives, or your financial situation. Simply Wall St has no position in the stocks mentioned.
We aim to bring you long-term focused research analysis driven by fundamental data. Note that our analysis may not factor in the latest price-sensitive company announcements or qualitative material. Thank you for reading.

