Does Total Produce plc (ISE:T7O) Have A Good P/E Ratio?

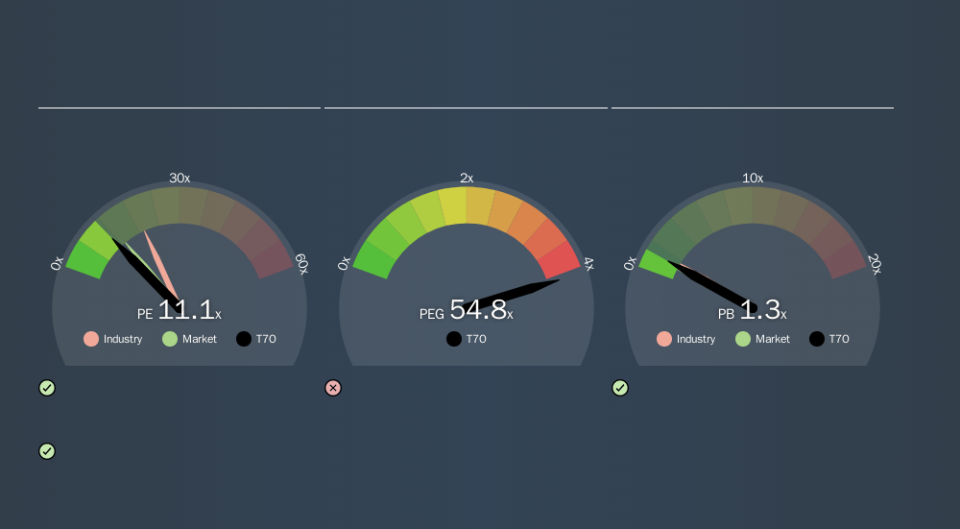
This article is for investors who would like to improve their understanding of price to earnings ratios (P/E ratios). To keep it practical, we'll show how Total Produce plc's (ISE:T7O) P/E ratio could help you assess the value on offer. Looking at earnings over the last twelve months, Total Produce has a P/E ratio of 11.15. In other words, at today's prices, investors are paying €11.15 for every €1 in prior year profit.
See our latest analysis for Total Produce
How Do You Calculate A P/E Ratio?
The formula for P/E is:
Price to Earnings Ratio = Price per Share ÷ Earnings per Share (EPS)
Or for Total Produce:
P/E of 11.15 = €1.50 ÷ €0.13 (Based on the trailing twelve months to June 2019.)
Is A High Price-to-Earnings Ratio Good?
The higher the P/E ratio, the higher the price tag of a business, relative to its trailing earnings. All else being equal, it's better to pay a low price -- but as Warren Buffett said, 'It's far better to buy a wonderful company at a fair price than a fair company at a wonderful price.
Does Total Produce Have A Relatively High Or Low P/E For Its Industry?
The P/E ratio indicates whether the market has higher or lower expectations of a company. If you look at the image below, you can see Total Produce has a lower P/E than the average (19.5) in the consumer retailing industry classification.
This suggests that market participants think Total Produce will underperform other companies in its industry. Since the market seems unimpressed with Total Produce, it's quite possible it could surprise on the upside. You should delve deeper. I like to check if company insiders have been buying or selling.
How Growth Rates Impact P/E Ratios
P/E ratios primarily reflect market expectations around earnings growth rates. If earnings are growing quickly, then the 'E' in the equation will increase faster than it would otherwise. Therefore, even if you pay a high multiple of earnings now, that multiple will become lower in the future. A lower P/E should indicate the stock is cheap relative to others -- and that may attract buyers.
Total Produce's earnings per share fell by 10% in the last twelve months. But EPS is up 6.0% over the last 5 years.
Remember: P/E Ratios Don't Consider The Balance Sheet
One drawback of using a P/E ratio is that it considers market capitalization, but not the balance sheet. Thus, the metric does not reflect cash or debt held by the company. In theory, a company can lower its future P/E ratio by using cash or debt to invest in growth.
Spending on growth might be good or bad a few years later, but the point is that the P/E ratio does not account for the option (or lack thereof).
So What Does Total Produce's Balance Sheet Tell Us?
Total Produce has net debt equal to 49% of its market cap. While it's worth keeping this in mind, it isn't a worry.
The Verdict On Total Produce's P/E Ratio
Total Produce has a P/E of 11.1. That's below the average in the IE market, which is 12.9. With only modest debt, it's likely the lack of EPS growth at least partially explains the pessimism implied by the P/E ratio.
When the market is wrong about a stock, it gives savvy investors an opportunity. If it is underestimating a company, investors can make money by buying and holding the shares until the market corrects itself. So this free report on the analyst consensus forecasts could help you make a master move on this stock.
Of course you might be able to find a better stock than Total Produce. So you may wish to see this free collection of other companies that have grown earnings strongly.
If you spot an error that warrants correction, please contact the editor at editorial-team@simplywallst.com. This article by Simply Wall St is general in nature. It does not constitute a recommendation to buy or sell any stock, and does not take account of your objectives, or your financial situation. Simply Wall St has no position in the stocks mentioned.
We aim to bring you long-term focused research analysis driven by fundamental data. Note that our analysis may not factor in the latest price-sensitive company announcements or qualitative material. Thank you for reading.
