How Does Valero Energy's (NYSE:VLO) P/E Compare To Its Industry, After The Share Price Drop?

To the annoyance of some shareholders, Valero Energy (NYSE:VLO) shares are down a considerable 33% in the last month. Indeed the recent decline has arguably caused some bitterness for shareholders who have held through the 46% drop over twelve months.
Assuming nothing else has changed, a lower share price makes a stock more attractive to potential buyers. In the long term, share prices tend to follow earnings per share, but in the short term prices bounce around in response to short term factors (which are not always obvious). The implication here is that long term investors have an opportunity when expectations of a company are too low. One way to gauge market expectations of a stock is to look at its Price to Earnings Ratio (PE Ratio). Investors have optimistic expectations of companies with higher P/E ratios, compared to companies with lower P/E ratios.
See our latest analysis for Valero Energy
How Does Valero Energy's P/E Ratio Compare To Its Peers?
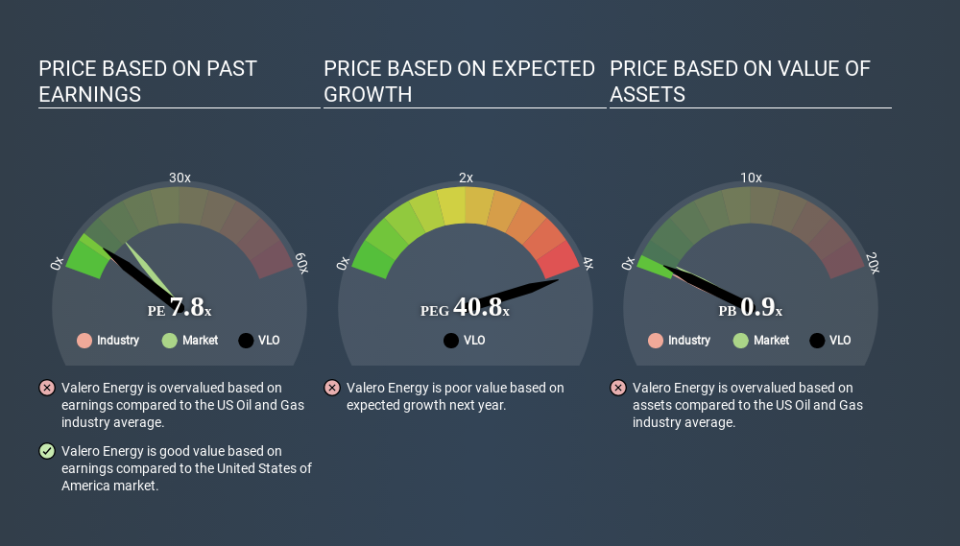
We can tell from its P/E ratio of 7.76 that there is some investor optimism about Valero Energy. As you can see below, Valero Energy has a higher P/E than the average company (6.9) in the oil and gas industry.
Valero Energy's P/E tells us that market participants think the company will perform better than its industry peers, going forward. The market is optimistic about the future, but that doesn't guarantee future growth. So further research is always essential. I often monitor director buying and selling.
How Growth Rates Impact P/E Ratios
P/E ratios primarily reflect market expectations around earnings growth rates. That's because companies that grow earnings per share quickly will rapidly increase the 'E' in the equation. And in that case, the P/E ratio itself will drop rather quickly. So while a stock may look expensive based on past earnings, it could be cheap based on future earnings.
Valero Energy saw earnings per share decrease by 20% last year. But EPS is up 5.7% over the last 3 years. And it has shrunk its earnings per share by 3.6% per year over the last five years. This might lead to muted expectations.
Don't Forget: The P/E Does Not Account For Debt or Bank Deposits
It's important to note that the P/E ratio considers the market capitalization, not the enterprise value. Thus, the metric does not reflect cash or debt held by the company. In theory, a company can lower its future P/E ratio by using cash or debt to invest in growth.
Such expenditure might be good or bad, in the long term, but the point here is that the balance sheet is not reflected by this ratio.
Is Debt Impacting Valero Energy's P/E?
Net debt is 34% of Valero Energy's market cap. You'd want to be aware of this fact, but it doesn't bother us.
The Verdict On Valero Energy's P/E Ratio
Valero Energy trades on a P/E ratio of 7.8, which is below the US market average of 13.1. Since it only carries a modest debt load, it's likely the low expectations implied by the P/E ratio arise from the lack of recent earnings growth. What can be absolutely certain is that the market has become more pessimistic about Valero Energy over the last month, with the P/E ratio falling from 11.6 back then to 7.8 today. For those who prefer invest in growth, this stock apparently offers limited promise, but the deep value investors may find the pessimism around this stock enticing.
When the market is wrong about a stock, it gives savvy investors an opportunity. As value investor Benjamin Graham famously said, 'In the short run, the market is a voting machine but in the long run, it is a weighing machine. So this free visual report on analyst forecasts could hold the key to an excellent investment decision.
Of course you might be able to find a better stock than Valero Energy. So you may wish to see this free collection of other companies that have grown earnings strongly.
If you spot an error that warrants correction, please contact the editor at editorial-team@simplywallst.com. This article by Simply Wall St is general in nature. It does not constitute a recommendation to buy or sell any stock, and does not take account of your objectives, or your financial situation. Simply Wall St has no position in the stocks mentioned.
We aim to bring you long-term focused research analysis driven by fundamental data. Note that our analysis may not factor in the latest price-sensitive company announcements or qualitative material. Thank you for reading.

