What Does Wilmar International Limited's (SGX:F34) P/E Ratio Tell You?

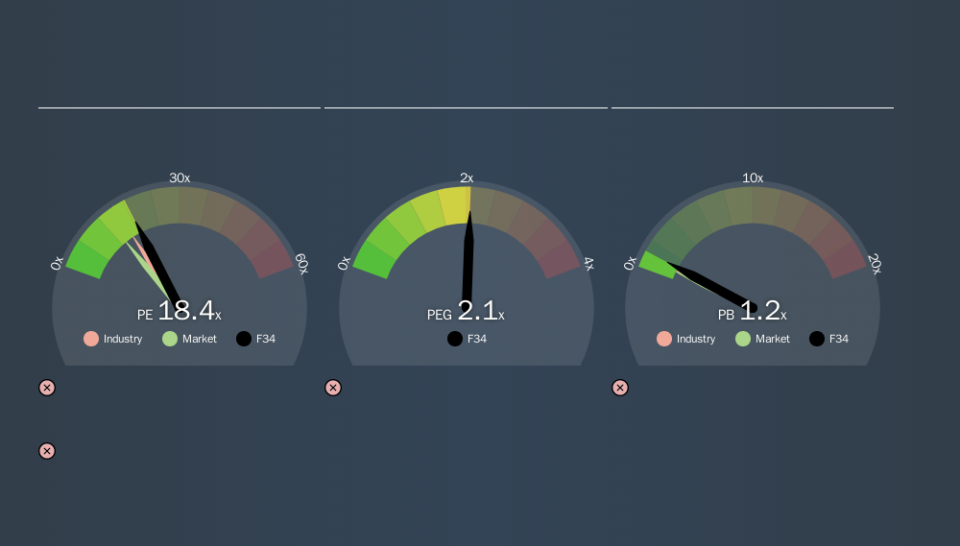
The goal of this article is to teach you how to use price to earnings ratios (P/E ratios). We'll look at Wilmar International Limited's (SGX:F34) P/E ratio and reflect on what it tells us about the company's share price. What is Wilmar International's P/E ratio? Well, based on the last twelve months it is 18.43. That is equivalent to an earnings yield of about 5.4%.
Check out our latest analysis for Wilmar International
How Do You Calculate Wilmar International's P/E Ratio?
The formula for price to earnings is:
Price to Earnings Ratio = Price per Share (in the reporting currency) ÷ Earnings per Share (EPS)
Or for Wilmar International:
P/E of 18.43 = SGD3.00 (Note: this is the share price in the reporting currency, namely, USD ) ÷ SGD0.16 (Based on the year to September 2019.)
Is A High P/E Ratio Good?
The higher the P/E ratio, the higher the price tag of a business, relative to its trailing earnings. All else being equal, it's better to pay a low price -- but as Warren Buffett said, 'It's far better to buy a wonderful company at a fair price than a fair company at a wonderful price.
Does Wilmar International Have A Relatively High Or Low P/E For Its Industry?
The P/E ratio indicates whether the market has higher or lower expectations of a company. The image below shows that Wilmar International has a higher P/E than the average (15.9) P/E for companies in the food industry.
Its relatively high P/E ratio indicates that Wilmar International shareholders think it will perform better than other companies in its industry classification. Clearly the market expects growth, but it isn't guaranteed. So further research is always essential. I often monitor director buying and selling.
How Growth Rates Impact P/E Ratios
P/E ratios primarily reflect market expectations around earnings growth rates. Earnings growth means that in the future the 'E' will be higher. And in that case, the P/E ratio itself will drop rather quickly. And as that P/E ratio drops, the company will look cheap, unless its share price increases.
Wilmar International's earnings per share fell by 25% in the last twelve months. But it has grown its earnings per share by 12% per year over the last three years. And it has shrunk its earnings per share by 1.5% per year over the last five years. This growth rate might warrant a below average P/E ratio.
Don't Forget: The P/E Does Not Account For Debt or Bank Deposits
One drawback of using a P/E ratio is that it considers market capitalization, but not the balance sheet. So it won't reflect the advantage of cash, or disadvantage of debt. Hypothetically, a company could reduce its future P/E ratio by spending its cash (or taking on debt) to achieve higher earnings.
While growth expenditure doesn't always pay off, the point is that it is a good option to have; but one that the P/E ratio ignores.
How Does Wilmar International's Debt Impact Its P/E Ratio?
Net debt totals 94% of Wilmar International's market cap. This is a reasonably significant level of debt -- all else being equal you'd expect a much lower P/E than if it had net cash.
The Verdict On Wilmar International's P/E Ratio
Wilmar International trades on a P/E ratio of 18.4, which is above its market average of 13.3. With relatively high debt, and no earnings per share growth over twelve months, it's safe to say the market believes the company will improve its earnings growth in the future.
Investors should be looking to buy stocks that the market is wrong about. If the reality for a company is better than it expects, you can make money by buying and holding for the long term. So this free visualization of the analyst consensus on future earnings could help you make the right decision about whether to buy, sell, or hold.
Of course you might be able to find a better stock than Wilmar International. So you may wish to see this free collection of other companies that have grown earnings strongly.
We aim to bring you long-term focused research analysis driven by fundamental data. Note that our analysis may not factor in the latest price-sensitive company announcements or qualitative material.
If you spot an error that warrants correction, please contact the editor at editorial-team@simplywallst.com. This article by Simply Wall St is general in nature. It does not constitute a recommendation to buy or sell any stock, and does not take account of your objectives, or your financial situation. Simply Wall St has no position in the stocks mentioned. Thank you for reading.

