What Does Wison Engineering Services Co. Ltd.'s (HKG:2236) P/E Ratio Tell You?

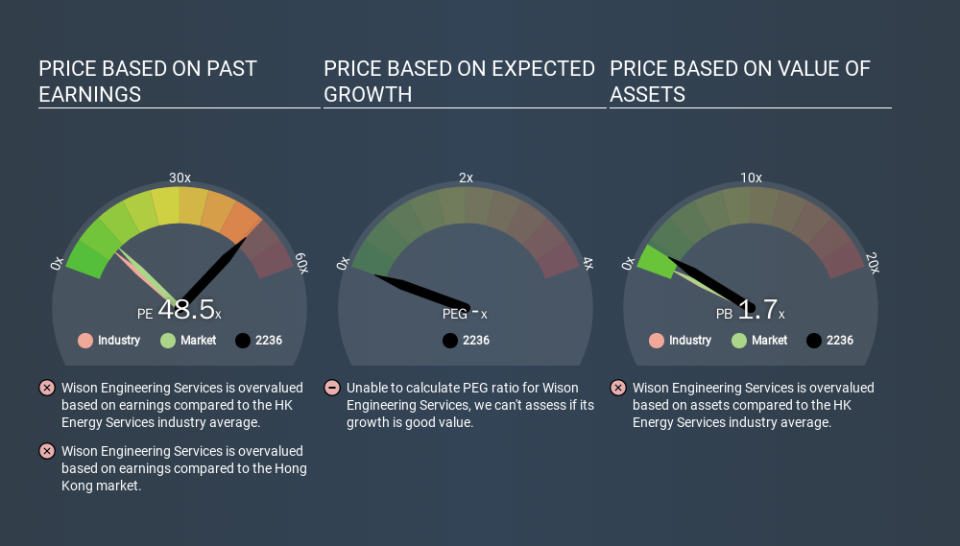
The goal of this article is to teach you how to use price to earnings ratios (P/E ratios). We'll apply a basic P/E ratio analysis to Wison Engineering Services Co. Ltd.'s (HKG:2236), to help you decide if the stock is worth further research. Looking at earnings over the last twelve months, Wison Engineering Services has a P/E ratio of 48.53. That is equivalent to an earnings yield of about 2.1%.
See our latest analysis for Wison Engineering Services
How Do I Calculate A Price To Earnings Ratio?
The formula for P/E is:
Price to Earnings Ratio = Price per Share (in the reporting currency) ÷ Earnings per Share (EPS)
Or for Wison Engineering Services:
P/E of 48.53 = CNY0.71 (Note: this is the share price in the reporting currency, namely, CNY ) ÷ CNY0.01 (Based on the trailing twelve months to June 2019.)
Is A High P/E Ratio Good?
A higher P/E ratio means that buyers have to pay a higher price for each CNY1 the company has earned over the last year. All else being equal, it's better to pay a low price -- but as Warren Buffett said, 'It's far better to buy a wonderful company at a fair price than a fair company at a wonderful price'.
Does Wison Engineering Services Have A Relatively High Or Low P/E For Its Industry?
The P/E ratio indicates whether the market has higher or lower expectations of a company. As you can see below, Wison Engineering Services has a much higher P/E than the average company (9.0) in the energy services industry.
Wison Engineering Services's P/E tells us that market participants think the company will perform better than its industry peers, going forward. Shareholders are clearly optimistic, but the future is always uncertain. So investors should always consider the P/E ratio alongside other factors, such as whether company directors have been buying shares.
How Growth Rates Impact P/E Ratios
When earnings fall, the 'E' decreases, over time. That means unless the share price falls, the P/E will increase in a few years. A higher P/E should indicate the stock is expensive relative to others -- and that may encourage shareholders to sell.
Wison Engineering Services's earnings per share fell by 44% in the last twelve months. And EPS is down 7.6% a year, over the last 3 years. This might lead to low expectations.
Remember: P/E Ratios Don't Consider The Balance Sheet
It's important to note that the P/E ratio considers the market capitalization, not the enterprise value. So it won't reflect the advantage of cash, or disadvantage of debt. Theoretically, a business can improve its earnings (and produce a lower P/E in the future) by investing in growth. That means taking on debt (or spending its cash).
While growth expenditure doesn't always pay off, the point is that it is a good option to have; but one that the P/E ratio ignores.
Is Debt Impacting Wison Engineering Services's P/E?
With net cash of CN¥367m, Wison Engineering Services has a very strong balance sheet, which may be important for its business. Having said that, at 12% of its market capitalization the cash hoard would contribute towards a higher P/E ratio.
The Verdict On Wison Engineering Services's P/E Ratio
Wison Engineering Services trades on a P/E ratio of 48.5, which is multiples above its market average of 10.6. Falling earnings per share is probably keeping traditional value investors away, but the net cash position means the company has time to improve: and the high P/E suggests the market thinks it will.
When the market is wrong about a stock, it gives savvy investors an opportunity. As value investor Benjamin Graham famously said, 'In the short run, the market is a voting machine but in the long run, it is a weighing machine. We don't have analyst forecasts, but shareholders might want to examine this detailed historical graph of earnings, revenue and cash flow.
But note: Wison Engineering Services may not be the best stock to buy. So take a peek at this free list of interesting companies with strong recent earnings growth (and a P/E ratio below 20).
If you spot an error that warrants correction, please contact the editor at editorial-team@simplywallst.com. This article by Simply Wall St is general in nature. It does not constitute a recommendation to buy or sell any stock, and does not take account of your objectives, or your financial situation. Simply Wall St has no position in the stocks mentioned.
We aim to bring you long-term focused research analysis driven by fundamental data. Note that our analysis may not factor in the latest price-sensitive company announcements or qualitative material. Thank you for reading.
