Does Yancoal Australia Ltd's (ASX:YAL) P/E Ratio Signal A Buying Opportunity?

The goal of this article is to teach you how to use price to earnings ratios (P/E ratios). We'll show how you can use Yancoal Australia Ltd's (ASX:YAL) P/E ratio to inform your assessment of the investment opportunity. Yancoal Australia has a P/E ratio of 3.95, based on the last twelve months. That means that at current prices, buyers pay A$3.95 for every A$1 in trailing yearly profits.
View our latest analysis for Yancoal Australia
How Do I Calculate A Price To Earnings Ratio?
The formula for P/E is:
Price to Earnings Ratio = Share Price ÷ Earnings per Share (EPS)
Or for Yancoal Australia:
P/E of 3.95 = A$2.150 ÷ A$0.545 (Based on the year to December 2019.)
(Note: the above calculation results may not be precise due to rounding.)
Is A High Price-to-Earnings Ratio Good?
The higher the P/E ratio, the higher the price tag of a business, relative to its trailing earnings. All else being equal, it's better to pay a low price -- but as Warren Buffett said, 'It's far better to buy a wonderful company at a fair price than a fair company at a wonderful price'.
How Does Yancoal Australia's P/E Ratio Compare To Its Peers?
The P/E ratio indicates whether the market has higher or lower expectations of a company. If you look at the image below, you can see Yancoal Australia has a lower P/E than the average (7.0) in the oil and gas industry classification.
This suggests that market participants think Yancoal Australia will underperform other companies in its industry. Many investors like to buy stocks when the market is pessimistic about their prospects. If you consider the stock interesting, further research is recommended. For example, I often monitor director buying and selling.
How Growth Rates Impact P/E Ratios
P/E ratios primarily reflect market expectations around earnings growth rates. If earnings are growing quickly, then the 'E' in the equation will increase faster than it would otherwise. That means even if the current P/E is high, it will reduce over time if the share price stays flat. And as that P/E ratio drops, the company will look cheap, unless its share price increases.
Yancoal Australia saw earnings per share decrease by 19% last year.
Don't Forget: The P/E Does Not Account For Debt or Bank Deposits
Don't forget that the P/E ratio considers market capitalization. That means it doesn't take debt or cash into account. Theoretically, a business can improve its earnings (and produce a lower P/E in the future) by investing in growth. That means taking on debt (or spending its cash).
Spending on growth might be good or bad a few years later, but the point is that the P/E ratio does not account for the option (or lack thereof).
So What Does Yancoal Australia's Balance Sheet Tell Us?
Yancoal Australia's net debt is 84% of its market cap. If you want to compare its P/E ratio to other companies, you should absolutely keep in mind it has significant borrowings.
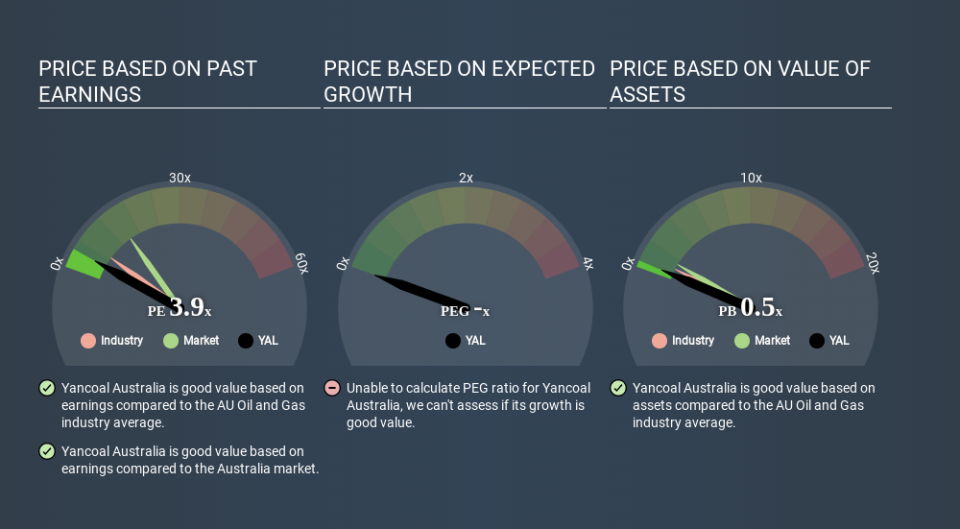
The Verdict On Yancoal Australia's P/E Ratio
Yancoal Australia trades on a P/E ratio of 3.9, which is below the AU market average of 14.9. When you consider that the company has significant debt, and didn't grow EPS last year, it isn't surprising that the market has muted expectations.
Investors have an opportunity when market expectations about a stock are wrong. If the reality for a company is not as bad as the P/E ratio indicates, then the share price should increase as the market realizes this. So this free visual report on analyst forecasts could hold the key to an excellent investment decision.
Of course, you might find a fantastic investment by looking at a few good candidates. So take a peek at this free list of companies with modest (or no) debt, trading on a P/E below 20.
Love or hate this article? Concerned about the content? Get in touch with us directly. Alternatively, email editorial-team@simplywallst.com.
This article by Simply Wall St is general in nature. It does not constitute a recommendation to buy or sell any stock, and does not take account of your objectives, or your financial situation. We aim to bring you long-term focused analysis driven by fundamental data. Note that our analysis may not factor in the latest price-sensitive company announcements or qualitative material. Simply Wall St has no position in any stocks mentioned. Thank you for reading.
