Is Dollar General Corporation's (NYSE:DG) Balance Sheet Strong Enough To Weather A Storm?

There are a number of reasons that attract investors towards large-cap companies such as Dollar General Corporation (NYSE:DG), with a market cap of US$31b. One reason being its ‘too big to fail’ aura which gives it the appearance of a strong and stable investment. However, the key to extending previous success is in the health of the company’s financials. Let’s take a look at Dollar General’s leverage and assess its financial strength to get an idea of their ability to fund strategic acquisitions and grow through cyclical pressures. Remember this is a very top-level look that focuses exclusively on financial health, so I recommend a deeper analysis into DG here.
Want to participate in a short research study? Help shape the future of investing tools and you could win a $250 gift card!
See our latest analysis for Dollar General
Does DG Produce Much Cash Relative To Its Debt?
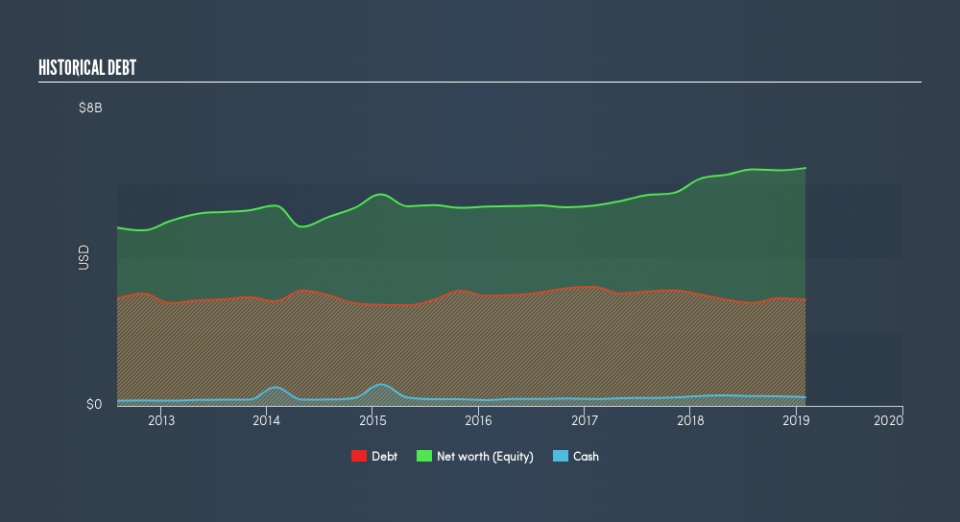
Over the past year, DG has maintained its debt levels at around US$2.9b including long-term debt. At this stable level of debt, DG's cash and short-term investments stands at US$235m , ready to be used for running the business. Moreover, DG has produced cash from operations of US$2.1b over the same time period, leading to an operating cash to total debt ratio of 75%, signalling that DG’s debt is appropriately covered by operating cash.
Can DG pay its short-term liabilities?
With current liabilities at US$3.0b, it seems that the business has maintained a safe level of current assets to meet its obligations, with the current ratio last standing at 1.55x. The current ratio is the number you get when you divide current assets by current liabilities. For Multiline Retail companies, this ratio is within a sensible range since there's a sufficient cash cushion without leaving too much capital idle or in low-earning investments.
Can DG service its debt comfortably?
With debt reaching 45% of equity, DG may be thought of as relatively highly levered. This isn’t surprising for large-caps, as equity can often be more expensive to issue than debt, plus interest payments are tax deductible. Accordingly, large companies often have lower cost of capital due to easily obtained financing, providing an advantage over smaller companies. We can test if DG’s debt levels are sustainable by measuring interest payments against earnings of a company. Preferably, earnings before interest and tax (EBIT) should be at least three times as large as net interest. In DG's case, the ratio of 21.23x suggests that interest is comfortably covered. High interest coverage serves as an indication of the safety of a company, which highlights why many large organisations like DG are considered a risk-averse investment.
Next Steps:
Although DG’s debt level is towards the higher end of the spectrum, its cash flow coverage seems adequate to meet obligations which means its debt is being efficiently utilised. This may mean this is an optimal capital structure for the business, given that it is also meeting its short-term commitment. This is only a rough assessment of financial health, and I'm sure DG has company-specific issues impacting its capital structure decisions. You should continue to research Dollar General to get a better picture of the large-cap by looking at:
Future Outlook: What are well-informed industry analysts predicting for DG’s future growth? Take a look at our free research report of analyst consensus for DG’s outlook.
Valuation: What is DG worth today? Is the stock undervalued, even when its growth outlook is factored into its intrinsic value? The intrinsic value infographic in our free research report helps visualize whether DG is currently mispriced by the market.
Other High-Performing Stocks: Are there other stocks that provide better prospects with proven track records? Explore our free list of these great stocks here.
We aim to bring you long-term focused research analysis driven by fundamental data. Note that our analysis may not factor in the latest price-sensitive company announcements or qualitative material.
If you spot an error that warrants correction, please contact the editor at editorial-team@simplywallst.com. This article by Simply Wall St is general in nature. It does not constitute a recommendation to buy or sell any stock, and does not take account of your objectives, or your financial situation. Simply Wall St has no position in the stocks mentioned. Thank you for reading.
