Don’t Buy Chinney Alliance Group Limited (HKG:385) Until You Understand Its ROCE

Today we are going to look at Chinney Alliance Group Limited (HKG:385) to see whether it might be an attractive investment prospect. Specifically, we'll consider its Return On Capital Employed (ROCE), since that will give us an insight into how efficiently the business can generate profits from the capital it requires.
First up, we'll look at what ROCE is and how we calculate it. Second, we'll look at its ROCE compared to similar companies. Last but not least, we'll look at what impact its current liabilities have on its ROCE.
What is Return On Capital Employed (ROCE)?
ROCE measures the 'return' (pre-tax profit) a company generates from capital employed in its business. All else being equal, a better business will have a higher ROCE. In brief, it is a useful tool, but it is not without drawbacks. Renowned investment researcher Michael Mauboussin has suggested that a high ROCE can indicate that 'one dollar invested in the company generates value of more than one dollar'.
So, How Do We Calculate ROCE?
Analysts use this formula to calculate return on capital employed:
Return on Capital Employed = Earnings Before Interest and Tax (EBIT) ÷ (Total Assets - Current Liabilities)
Or for Chinney Alliance Group:
0.12 = HK$266m ÷ (HK$3.7b - HK$1.5b) (Based on the trailing twelve months to June 2019.)
So, Chinney Alliance Group has an ROCE of 12%.
See our latest analysis for Chinney Alliance Group
Is Chinney Alliance Group's ROCE Good?
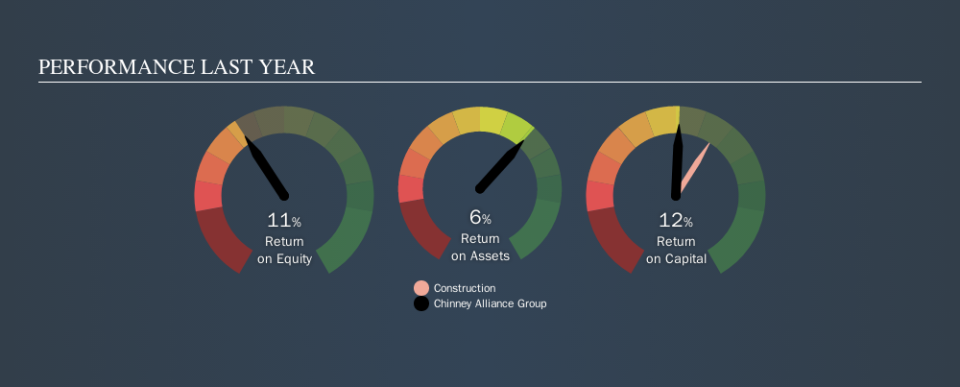
ROCE is commonly used for comparing the performance of similar businesses. Using our data, Chinney Alliance Group's ROCE appears to be around the 12% average of the Construction industry. Separate from Chinney Alliance Group's performance relative to its industry, its ROCE in absolute terms looks satisfactory, and it may be worth researching in more depth.
The image below shows how Chinney Alliance Group's ROCE compares to its industry, and you can click it to see more detail on its past growth.
When considering this metric, keep in mind that it is backwards looking, and not necessarily predictive. Companies in cyclical industries can be difficult to understand using ROCE, as returns typically look high during boom times, and low during busts. This is because ROCE only looks at one year, instead of considering returns across a whole cycle. You can check if Chinney Alliance Group has cyclical profits by looking at this free graph of past earnings, revenue and cash flow.
How Chinney Alliance Group's Current Liabilities Impact Its ROCE
Current liabilities are short term bills and invoices that need to be paid in 12 months or less. Due to the way ROCE is calculated, a high level of current liabilities makes a company look as though it has less capital employed, and thus can (sometimes unfairly) boost the ROCE. To counteract this, we check if a company has high current liabilities, relative to its total assets.
Chinney Alliance Group has total liabilities of HK$1.5b and total assets of HK$3.7b. As a result, its current liabilities are equal to approximately 41% of its total assets. Chinney Alliance Group has a middling amount of current liabilities, increasing its ROCE somewhat.
The Bottom Line On Chinney Alliance Group's ROCE
While its ROCE looks good, it's worth remembering that the current liabilities are making the business look better. There might be better investments than Chinney Alliance Group out there, but you will have to work hard to find them . These promising businesses with rapidly growing earnings might be right up your alley.
I will like Chinney Alliance Group better if I see some big insider buys. While we wait, check out this free list of growing companies with considerable, recent, insider buying.
We aim to bring you long-term focused research analysis driven by fundamental data. Note that our analysis may not factor in the latest price-sensitive company announcements or qualitative material.
If you spot an error that warrants correction, please contact the editor at editorial-team@simplywallst.com. This article by Simply Wall St is general in nature. It does not constitute a recommendation to buy or sell any stock, and does not take account of your objectives, or your financial situation. Simply Wall St has no position in the stocks mentioned. Thank you for reading.
