Don’t Sell Jacobs Engineering Group Inc. (NYSE:JEC) Before You Read This

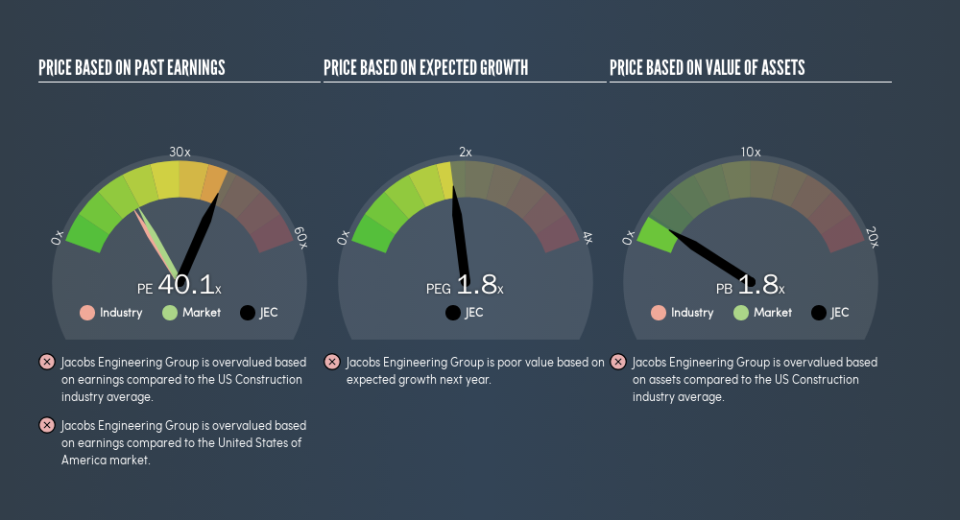
This article is written for those who want to get better at using price to earnings ratios (P/E ratios). To keep it practical, we’ll show how Jacobs Engineering Group Inc.’s (NYSE:JEC) P/E ratio could help you assess the value on offer. Based on the last twelve months, Jacobs Engineering Group’s P/E ratio is 40.07. That means that at current prices, buyers pay $40.07 for every $1 in trailing yearly profits.
View our latest analysis for Jacobs Engineering Group
How Do I Calculate Jacobs Engineering Group’s Price To Earnings Ratio?
The formula for P/E is:
Price to Earnings Ratio = Price per Share ÷ Earnings per Share (EPS)
Or for Jacobs Engineering Group:
P/E of 40.07 = $73.78 ÷ $1.84 (Based on the trailing twelve months to December 2018.)
Is A High P/E Ratio Good?
A higher P/E ratio implies that investors pay a higher price for the earning power of the business. That is not a good or a bad thing per se, but a high P/E does imply buyers are optimistic about the future.
How Growth Rates Impact P/E Ratios
If earnings fall then in the future the ‘E’ will be lower. Therefore, even if you pay a low multiple of earnings now, that multiple will become higher in the future. A higher P/E should indicate the stock is expensive relative to others — and that may encourage shareholders to sell.
It’s great to see that Jacobs Engineering Group grew EPS by 13% in the last year. Unfortunately, earnings per share are down 13% a year, over 5 years.
How Does Jacobs Engineering Group’s P/E Ratio Compare To Its Peers?
We can get an indication of market expectations by looking at the P/E ratio. The image below shows that Jacobs Engineering Group has a higher P/E than the average (17.4) P/E for companies in the construction industry.
Its relatively high P/E ratio indicates that Jacobs Engineering Group shareholders think it will perform better than other companies in its industry classification. Shareholders are clearly optimistic, but the future is always uncertain. So investors should always consider the P/E ratio alongside other factors, such as whether company directors have been buying shares.
Don’t Forget: The P/E Does Not Account For Debt or Bank Deposits
Don’t forget that the P/E ratio considers market capitalization. In other words, it does not consider any debt or cash that the company may have on the balance sheet. Hypothetically, a company could reduce its future P/E ratio by spending its cash (or taking on debt) to achieve higher earnings.
Such spending might be good or bad, overall, but the key point here is that you need to look at debt to understand the P/E ratio in context.
Jacobs Engineering Group’s Balance Sheet
Net debt totals 17% of Jacobs Engineering Group’s market cap. This could bring some additional risk, and reduce the number of investment options for management; worth remembering if you compare its P/E to businesses without debt.
The Verdict On Jacobs Engineering Group’s P/E Ratio
Jacobs Engineering Group trades on a P/E ratio of 40.1, which is above the US market average of 17.6. The company is not overly constrained by its modest debt levels, and it is growing earnings per share. Therefore it seems reasonable that the market would have relatively high expectations of the company
Investors have an opportunity when market expectations about a stock are wrong. If the reality for a company is better than it expects, you can make money by buying and holding for the long term. So this free report on the analyst consensus forecasts could help you make a master move on this stock.
You might be able to find a better buy than Jacobs Engineering Group. If you want a selection of possible winners, check out this free list of interesting companies that trade on a P/E below 20 (but have proven they can grow earnings).
We aim to bring you long-term focused research analysis driven by fundamental data. Note that our analysis may not factor in the latest price-sensitive company announcements or qualitative material.
If you spot an error that warrants correction, please contact the editor at editorial-team@simplywallst.com. This article by Simply Wall St is general in nature. It does not constitute a recommendation to buy or sell any stock, and does not take account of your objectives, or your financial situation. Simply Wall St has no position in the stocks mentioned. Thank you for reading.

