Don’t Sell Warpaint London PLC (LON:W7L) Before You Read This

Want to participate in a short research study? Help shape the future of investing tools and you could win a $250 gift card!
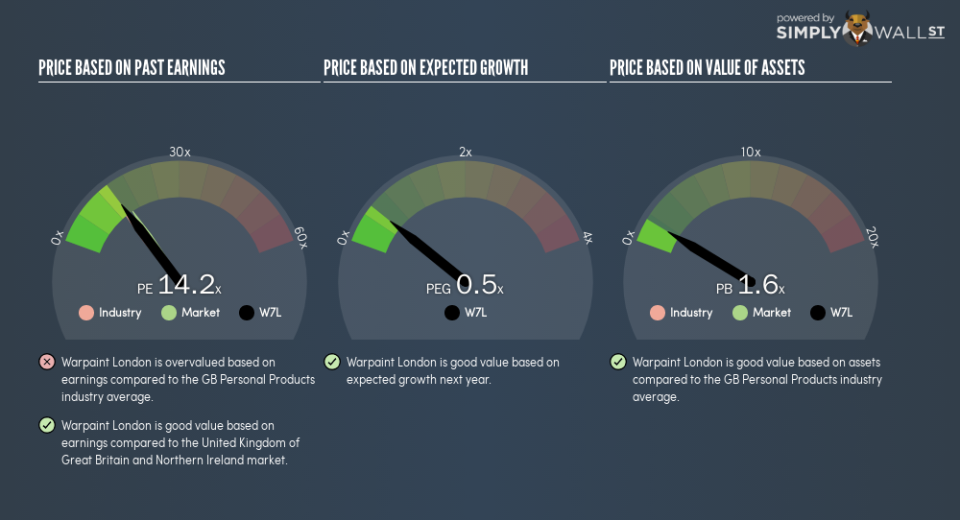
This article is for investors who would like to improve their understanding of price to earnings ratios (P/E ratios). We’ll look at Warpaint London PLC’s (LON:W7L) P/E ratio and reflect on what it tells us about the company’s share price. Based on the last twelve months, Warpaint London’s P/E ratio is 14.24. In other words, at today’s prices, investors are paying £14.24 for every £1 in prior year profit.
See our latest analysis for Warpaint London
How Do I Calculate A Price To Earnings Ratio?
The formula for P/E is:
Price to Earnings Ratio = Share Price ÷ Earnings per Share (EPS)
Or for Warpaint London:
P/E of 14.24 = £0.83 ÷ £0.059 (Based on the trailing twelve months to June 2018.)
Is A High Price-to-Earnings Ratio Good?
A higher P/E ratio means that buyers have to pay a higher price for each £1 the company has earned over the last year. All else being equal, it’s better to pay a low price — but as Warren Buffett said, ‘It’s far better to buy a wonderful company at a fair price than a fair company at a wonderful price.’
How Growth Rates Impact P/E Ratios
Probably the most important factor in determining what P/E a company trades on is the earnings growth. When earnings grow, the ‘E’ increases, over time. Therefore, even if you pay a high multiple of earnings now, that multiple will become lower in the future. So while a stock may look expensive based on past earnings, it could be cheap based on future earnings.
Most would be impressed by Warpaint London earnings growth of 16% in the last year.
How Does Warpaint London’s P/E Ratio Compare To Its Peers?
The P/E ratio indicates whether the market has higher or lower expectations of a company. As you can see below Warpaint London has a P/E ratio that is fairly close for the average for the personal products industry, which is 13.7.
That indicates that the market expects Warpaint London will perform roughly in line with other companies in its industry. So if Warpaint London actually outperforms its peers going forward, that should be a positive for the share price. Checking factors such as the tenure of the board and management could help you form your own view on if that will happen.
A Limitation: P/E Ratios Ignore Debt and Cash In The Bank
The ‘Price’ in P/E reflects the market capitalization of the company. Thus, the metric does not reflect cash or debt held by the company. Theoretically, a business can improve its earnings (and produce a lower P/E in the future), by taking on debt (or spending its remaining cash).
Spending on growth might be good or bad a few years later, but the point is that the P/E ratio does not account for the option (or lack thereof).
Is Debt Impacting Warpaint London’s P/E?
Since Warpaint London holds net cash of UK£4.6m, it can spend on growth, justifying a higher P/E ratio than otherwise.
The Bottom Line On Warpaint London’s P/E Ratio
Warpaint London’s P/E is 14.2 which is below average (15.7) in the GB market. It grew its EPS nicely over the last year, and the healthy balance sheet implies there is more potential for growth. The relatively low P/E ratio implies the market is pessimistic. Because analysts are predicting more growth in the future, one might have expected to see a higher P/E ratio. You can taker closer look at the fundamentals, here.
Investors have an opportunity when market expectations about a stock are wrong. If it is underestimating a company, investors can make money by buying and holding the shares until the market corrects itself. So this free visual report on analyst forecasts could hold they key to an excellent investment decision.
Of course, you might find a fantastic investment by looking at a few good candidates. So take a peek at this free list of companies with modest (or no) debt, trading on a P/E below 20.
To help readers see past the short term volatility of the financial market, we aim to bring you a long-term focused research analysis purely driven by fundamental data. Note that our analysis does not factor in the latest price-sensitive company announcements.
The author is an independent contributor and at the time of publication had no position in the stocks mentioned. For errors that warrant correction please contact the editor at editorial-team@simplywallst.com.
