Don't Sell ARB Corporation Limited (ASX:ARB) Before You Read This

Today, we'll introduce the concept of the P/E ratio for those who are learning about investing. We'll show how you can use ARB Corporation Limited's (ASX:ARB) P/E ratio to inform your assessment of the investment opportunity. Looking at earnings over the last twelve months, ARB has a P/E ratio of 25.76. In other words, at today's prices, investors are paying A$25.76 for every A$1 in prior year profit.
See our latest analysis for ARB
How Do You Calculate A P/E Ratio?
The formula for P/E is:
Price to Earnings Ratio = Share Price ÷ Earnings per Share (EPS)
Or for ARB:
P/E of 25.76 = AUD18.51 ÷ AUD0.72 (Based on the trailing twelve months to June 2019.)
Is A High Price-to-Earnings Ratio Good?
A higher P/E ratio implies that investors pay a higher price for the earning power of the business. That isn't a good or a bad thing on its own, but a high P/E means that buyers have a higher opinion of the business's prospects, relative to stocks with a lower P/E.
How Does ARB's P/E Ratio Compare To Its Peers?
The P/E ratio essentially measures market expectations of a company. You can see in the image below that the average P/E (15.6) for companies in the auto components industry is lower than ARB's P/E.
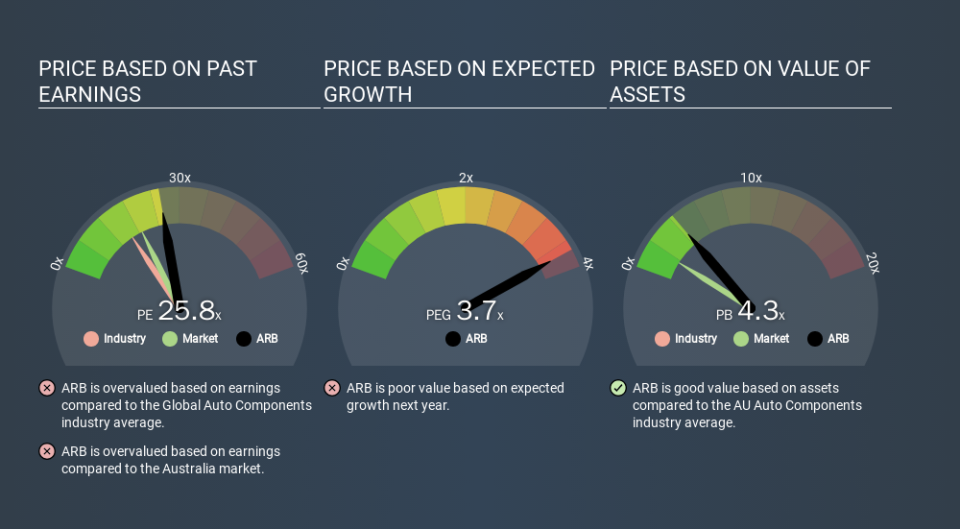
That means that the market expects ARB will outperform other companies in its industry. The market is optimistic about the future, but that doesn't guarantee future growth. So further research is always essential. I often monitor director buying and selling.
How Growth Rates Impact P/E Ratios
P/E ratios primarily reflect market expectations around earnings growth rates. If earnings are growing quickly, then the 'E' in the equation will increase faster than it would otherwise. That means even if the current P/E is high, it will reduce over time if the share price stays flat. And as that P/E ratio drops, the company will look cheap, unless its share price increases.
It's great to see that ARB grew EPS by 12% in the last year. And earnings per share have improved by 4.1% annually, over the last five years. So one might expect an above average P/E ratio.
A Limitation: P/E Ratios Ignore Debt and Cash In The Bank
One drawback of using a P/E ratio is that it considers market capitalization, but not the balance sheet. That means it doesn't take debt or cash into account. Hypothetically, a company could reduce its future P/E ratio by spending its cash (or taking on debt) to achieve higher earnings.
Spending on growth might be good or bad a few years later, but the point is that the P/E ratio does not account for the option (or lack thereof).
How Does ARB's Debt Impact Its P/E Ratio?
Since ARB holds net cash of AU$8.5m, it can spend on growth, justifying a higher P/E ratio than otherwise.
The Bottom Line On ARB's P/E Ratio
ARB's P/E is 25.8 which is above average (18.8) in its market. Its net cash position supports a higher P/E ratio, as does its solid recent earnings growth. Therefore it seems reasonable that the market would have relatively high expectations of the company
Investors have an opportunity when market expectations about a stock are wrong. If the reality for a company is better than it expects, you can make money by buying and holding for the long term. So this free report on the analyst consensus forecasts could help you make a master move on this stock.
Of course, you might find a fantastic investment by looking at a few good candidates. So take a peek at this free list of companies with modest (or no) debt, trading on a P/E below 20.
If you spot an error that warrants correction, please contact the editor at editorial-team@simplywallst.com. This article by Simply Wall St is general in nature. It does not constitute a recommendation to buy or sell any stock, and does not take account of your objectives, or your financial situation. Simply Wall St has no position in the stocks mentioned.
We aim to bring you long-term focused research analysis driven by fundamental data. Note that our analysis may not factor in the latest price-sensitive company announcements or qualitative material. Thank you for reading.

