Don't Sell CDW Holding Limited (SGX:BXE) Before You Read This

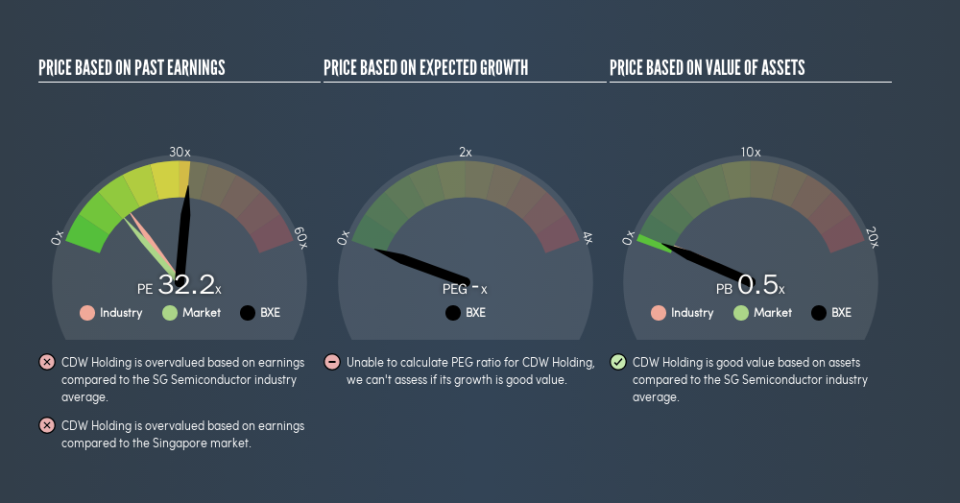
This article is for investors who would like to improve their understanding of price to earnings ratios (P/E ratios). We'll show how you can use CDW Holding Limited's (SGX:BXE) P/E ratio to inform your assessment of the investment opportunity. Looking at earnings over the last twelve months, CDW Holding has a P/E ratio of 32.21. That corresponds to an earnings yield of approximately 3.1%.
Want to participate in a short research study? Help shape the future of investing tools and you could win a $250 gift card!
See our latest analysis for CDW Holding
How Do I Calculate A Price To Earnings Ratio?
The formula for P/E is:
Price to Earnings Ratio = Price per Share (in the reporting currency) ÷ Earnings per Share (EPS)
Or for CDW Holding:
P/E of 32.21 = $0.13 (Note: this is the share price in the reporting currency, namely, USD ) ÷ $0.0039 (Based on the trailing twelve months to March 2019.)
Is A High P/E Ratio Good?
The higher the P/E ratio, the higher the price tag of a business, relative to its trailing earnings. All else being equal, it's better to pay a low price -- but as Warren Buffett said, 'It's far better to buy a wonderful company at a fair price than a fair company at a wonderful price.'
How Growth Rates Impact P/E Ratios
If earnings fall then in the future the 'E' will be lower. Therefore, even if you pay a low multiple of earnings now, that multiple will become higher in the future. Then, a higher P/E might scare off shareholders, pushing the share price down.
CDW Holding's earnings per share fell by 48% in the last twelve months. And it has shrunk its earnings per share by 38% per year over the last five years. This could justify a pessimistic P/E.
How Does CDW Holding's P/E Ratio Compare To Its Peers?
One good way to get a quick read on what market participants expect of a company is to look at its P/E ratio. As you can see below, CDW Holding has a higher P/E than the average company (14.8) in the semiconductor industry.
Its relatively high P/E ratio indicates that CDW Holding shareholders think it will perform better than other companies in its industry classification. Shareholders are clearly optimistic, but the future is always uncertain. So investors should delve deeper. I like to check if company insiders have been buying or selling.
Remember: P/E Ratios Don't Consider The Balance Sheet
It's important to note that the P/E ratio considers the market capitalization, not the enterprise value. So it won't reflect the advantage of cash, or disadvantage of debt. In theory, a company can lower its future P/E ratio by using cash or debt to invest in growth.
Such spending might be good or bad, overall, but the key point here is that you need to look at debt to understand the P/E ratio in context.
CDW Holding's Balance Sheet
CDW Holding has net cash of US$19m. This is fairly high at 67% of its market capitalization. That might mean balance sheet strength is important to the business, but should also help push the P/E a bit higher than it would otherwise be.
The Bottom Line On CDW Holding's P/E Ratio
CDW Holding trades on a P/E ratio of 32.2, which is above the SG market average of 12.5. The recent drop in earnings per share would make some investors cautious, but the net cash position means the company has time to improve: and the high P/E suggests the market thinks it will.
Investors should be looking to buy stocks that the market is wrong about. If the reality for a company is better than it expects, you can make money by buying and holding for the long term. We don't have analyst forecasts, but you could get a better understanding of its growth by checking out this more detailed historical graph of earnings, revenue and cash flow.
Of course you might be able to find a better stock than CDW Holding. So you may wish to see this free collection of other companies that have grown earnings strongly.
We aim to bring you long-term focused research analysis driven by fundamental data. Note that our analysis may not factor in the latest price-sensitive company announcements or qualitative material.
If you spot an error that warrants correction, please contact the editor at editorial-team@simplywallst.com. This article by Simply Wall St is general in nature. It does not constitute a recommendation to buy or sell any stock, and does not take account of your objectives, or your financial situation. Simply Wall St has no position in the stocks mentioned. Thank you for reading.

