Don't Sell Elis SA (EPA:ELIS) Before You Read This

This article is for investors who would like to improve their understanding of price to earnings ratios (P/E ratios). We'll show how you can use Elis SA's (EPA:ELIS) P/E ratio to inform your assessment of the investment opportunity. Looking at earnings over the last twelve months, Elis has a P/E ratio of 26.18. That means that at current prices, buyers pay €26.18 for every €1 in trailing yearly profits.
View our latest analysis for Elis
How Do I Calculate A Price To Earnings Ratio?
The formula for price to earnings is:
Price to Earnings Ratio = Share Price ÷ Earnings per Share (EPS)
Or for Elis:
P/E of 26.18 = €16.66 ÷ €0.64 (Based on the year to June 2019.)
Is A High P/E Ratio Good?
The higher the P/E ratio, the higher the price tag of a business, relative to its trailing earnings. All else being equal, it's better to pay a low price -- but as Warren Buffett said, 'It's far better to buy a wonderful company at a fair price than a fair company at a wonderful price.'
Does Elis Have A Relatively High Or Low P/E For Its Industry?
One good way to get a quick read on what market participants expect of a company is to look at its P/E ratio. You can see in the image below that the average P/E (16.8) for companies in the commercial services industry is lower than Elis's P/E.
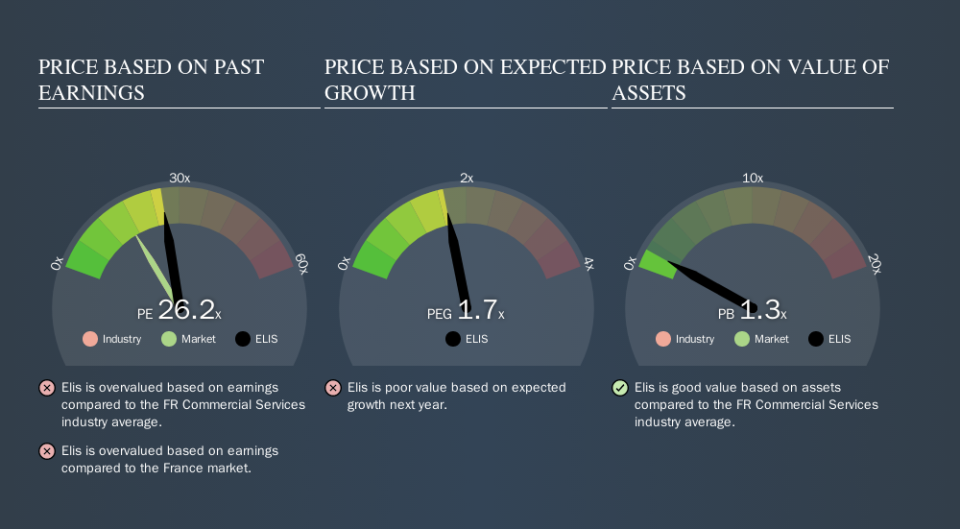
Its relatively high P/E ratio indicates that Elis shareholders think it will perform better than other companies in its industry classification. Clearly the market expects growth, but it isn't guaranteed. So investors should delve deeper. I like to check if company insiders have been buying or selling.
How Growth Rates Impact P/E Ratios
Generally speaking the rate of earnings growth has a profound impact on a company's P/E multiple. Earnings growth means that in the future the 'E' will be higher. That means even if the current P/E is high, it will reduce over time if the share price stays flat. And as that P/E ratio drops, the company will look cheap, unless its share price increases.
In the last year, Elis grew EPS like Taylor Swift grew her fan base back in 2010; the 370% gain was both fast and well deserved. Even better, EPS is up 17% per year over three years. So we'd absolutely expect it to have a relatively high P/E ratio.
Remember: P/E Ratios Don't Consider The Balance Sheet
One drawback of using a P/E ratio is that it considers market capitalization, but not the balance sheet. In other words, it does not consider any debt or cash that the company may have on the balance sheet. In theory, a company can lower its future P/E ratio by using cash or debt to invest in growth.
Such expenditure might be good or bad, in the long term, but the point here is that the balance sheet is not reflected by this ratio.
Elis's Balance Sheet
Elis's net debt is 97% of its market cap. This is enough debt that you'd have to make some adjustments before using the P/E ratio to compare it to a company with net cash.
The Verdict On Elis's P/E Ratio
Elis has a P/E of 26.2. That's higher than the average in its market, which is 16.8. Its meaningful level of debt should warrant a lower P/E ratio, but the fast EPS growth is a positive. So despite the debt it is, perhaps, not unreasonable to see a high P/E ratio.
Investors have an opportunity when market expectations about a stock are wrong. If the reality for a company is better than it expects, you can make money by buying and holding for the long term. So this free report on the analyst consensus forecasts could help you make a master move on this stock.
Of course you might be able to find a better stock than Elis. So you may wish to see this free collection of other companies that have grown earnings strongly.
We aim to bring you long-term focused research analysis driven by fundamental data. Note that our analysis may not factor in the latest price-sensitive company announcements or qualitative material.
If you spot an error that warrants correction, please contact the editor at editorial-team@simplywallst.com. This article by Simply Wall St is general in nature. It does not constitute a recommendation to buy or sell any stock, and does not take account of your objectives, or your financial situation. Simply Wall St has no position in the stocks mentioned. Thank you for reading.

