Don't Sell HeidelbergCement India Limited (NSE:HEIDELBERG) Before You Read This
This article is for investors who would like to improve their understanding of price to earnings ratios (P/E ratios). We'll look at HeidelbergCement India Limited's (NSE:HEIDELBERG) P/E ratio and reflect on what it tells us about the company's share price. What is HeidelbergCement India's P/E ratio? Well, based on the last twelve months it is 17.59. That means that at current prices, buyers pay ₹17.59 for every ₹1 in trailing yearly profits.
See our latest analysis for HeidelbergCement India
How Do I Calculate HeidelbergCement India's Price To Earnings Ratio?
The formula for price to earnings is:
Price to Earnings Ratio = Price per Share ÷ Earnings per Share (EPS)
Or for HeidelbergCement India:
P/E of 17.59 = ₹192.95 ÷ ₹10.97 (Based on the year to June 2019.)
Is A High P/E Ratio Good?
A higher P/E ratio implies that investors pay a higher price for the earning power of the business. That isn't necessarily good or bad, but a high P/E implies relatively high expectations of what a company can achieve in the future.
Does HeidelbergCement India Have A Relatively High Or Low P/E For Its Industry?
The P/E ratio indicates whether the market has higher or lower expectations of a company. The image below shows that HeidelbergCement India has a P/E ratio that is roughly in line with the basic materials industry average (17.5).
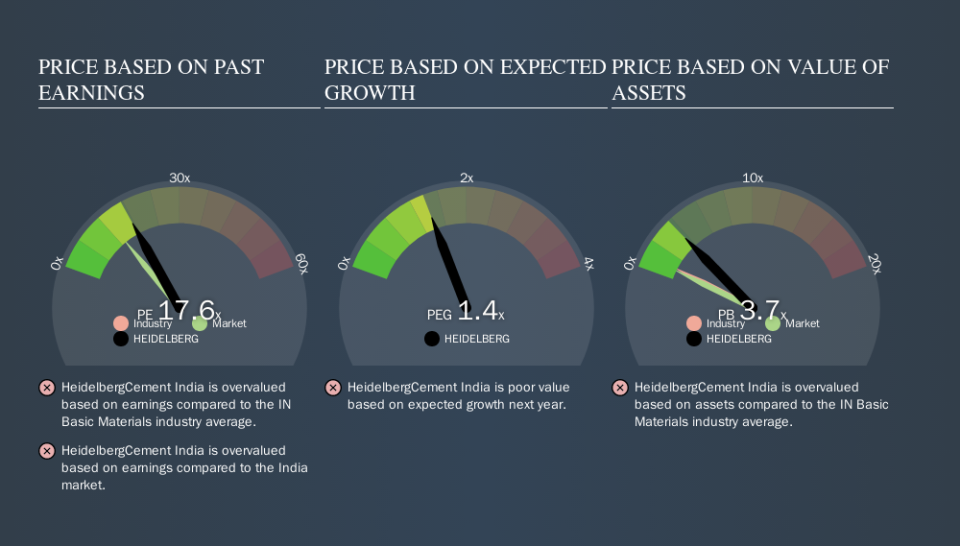
HeidelbergCement India's P/E tells us that market participants think its prospects are roughly in line with its industry. So if HeidelbergCement India actually outperforms its peers going forward, that should be a positive for the share price. Checking factors such as director buying and selling. could help you form your own view on if that will happen.
How Growth Rates Impact P/E Ratios
Earnings growth rates have a big influence on P/E ratios. When earnings grow, the 'E' increases, over time. That means unless the share price increases, the P/E will reduce in a few years. A lower P/E should indicate the stock is cheap relative to others -- and that may attract buyers.
It's nice to see that HeidelbergCement India grew EPS by a stonking 48% in the last year. And its annual EPS growth rate over 5 years is 65%. So we'd generally expect it to have a relatively high P/E ratio.
Remember: P/E Ratios Don't Consider The Balance Sheet
Don't forget that the P/E ratio considers market capitalization. So it won't reflect the advantage of cash, or disadvantage of debt. Hypothetically, a company could reduce its future P/E ratio by spending its cash (or taking on debt) to achieve higher earnings.
Spending on growth might be good or bad a few years later, but the point is that the P/E ratio does not account for the option (or lack thereof).
HeidelbergCement India's Balance Sheet
HeidelbergCement India's net debt is 1.2% of its market cap. So it doesn't have as many options as it would with net cash, but its debt would not have much of an impact on its P/E ratio.
The Verdict On HeidelbergCement India's P/E Ratio
HeidelbergCement India trades on a P/E ratio of 17.6, which is above its market average of 13.3. While the company does use modest debt, its recent earnings growth is superb. So on this analysis a high P/E ratio seems reasonable.
When the market is wrong about a stock, it gives savvy investors an opportunity. If the reality for a company is better than it expects, you can make money by buying and holding for the long term. So this free visual report on analyst forecasts could hold the key to an excellent investment decision.
But note: HeidelbergCement India may not be the best stock to buy. So take a peek at this free list of interesting companies with strong recent earnings growth (and a P/E ratio below 20).
We aim to bring you long-term focused research analysis driven by fundamental data. Note that our analysis may not factor in the latest price-sensitive company announcements or qualitative material.
If you spot an error that warrants correction, please contact the editor at editorial-team@simplywallst.com. This article by Simply Wall St is general in nature. It does not constitute a recommendation to buy or sell any stock, and does not take account of your objectives, or your financial situation. Simply Wall St has no position in the stocks mentioned. Thank you for reading.

