Don't Sell Honda Siel Power Products Limited (NSE:HONDAPOWER) Before You Read This

The goal of this article is to teach you how to use price to earnings ratios (P/E ratios). We'll apply a basic P/E ratio analysis to Honda Siel Power Products Limited's (NSE:HONDAPOWER), to help you decide if the stock is worth further research. Honda Siel Power Products has a price to earnings ratio of 19.76, based on the last twelve months. In other words, at today's prices, investors are paying ₹19.76 for every ₹1 in prior year profit.
See our latest analysis for Honda Siel Power Products
How Do You Calculate Honda Siel Power Products's P/E Ratio?
The formula for P/E is:
Price to Earnings Ratio = Share Price ÷ Earnings per Share (EPS)
Or for Honda Siel Power Products:
P/E of 19.76 = ₹1116.45 ÷ ₹56.51 (Based on the trailing twelve months to December 2018.)
Is A High Price-to-Earnings Ratio Good?
A higher P/E ratio means that buyers have to pay a higher price for each ₹1 the company has earned over the last year. That isn't a good or a bad thing on its own, but a high P/E means that buyers have a higher opinion of the business's prospects, relative to stocks with a lower P/E.
How Growth Rates Impact P/E Ratios
P/E ratios primarily reflect market expectations around earnings growth rates. Earnings growth means that in the future the 'E' will be higher. That means unless the share price increases, the P/E will reduce in a few years. So while a stock may look expensive based on past earnings, it could be cheap based on future earnings.
Honda Siel Power Products shrunk earnings per share by 2.0% last year. But EPS is up 27% over the last 5 years.
How Does Honda Siel Power Products's P/E Ratio Compare To Its Peers?
One good way to get a quick read on what market participants expect of a company is to look at its P/E ratio. As you can see below Honda Siel Power Products has a P/E ratio that is fairly close for the average for the machinery industry, which is 18.7.
Honda Siel Power Products's P/E tells us that market participants think its prospects are roughly in line with its industry. So if Honda Siel Power Products actually outperforms its peers going forward, that should be a positive for the share price. Further research into factors such asmanagement tenure, could help you form your own view on whether that is likely.
Don't Forget: The P/E Does Not Account For Debt or Bank Deposits
It's important to note that the P/E ratio considers the market capitalization, not the enterprise value. In other words, it does not consider any debt or cash that the company may have on the balance sheet. Hypothetically, a company could reduce its future P/E ratio by spending its cash (or taking on debt) to achieve higher earnings.
While growth expenditure doesn't always pay off, the point is that it is a good option to have; but one that the P/E ratio ignores.
Is Debt Impacting Honda Siel Power Products's P/E?
Honda Siel Power Products has net cash of ₹2.1b. This is fairly high at 19% of its market capitalization. That might mean balance sheet strength is important to the business, but should also help push the P/E a bit higher than it would otherwise be.
The Bottom Line On Honda Siel Power Products's P/E Ratio
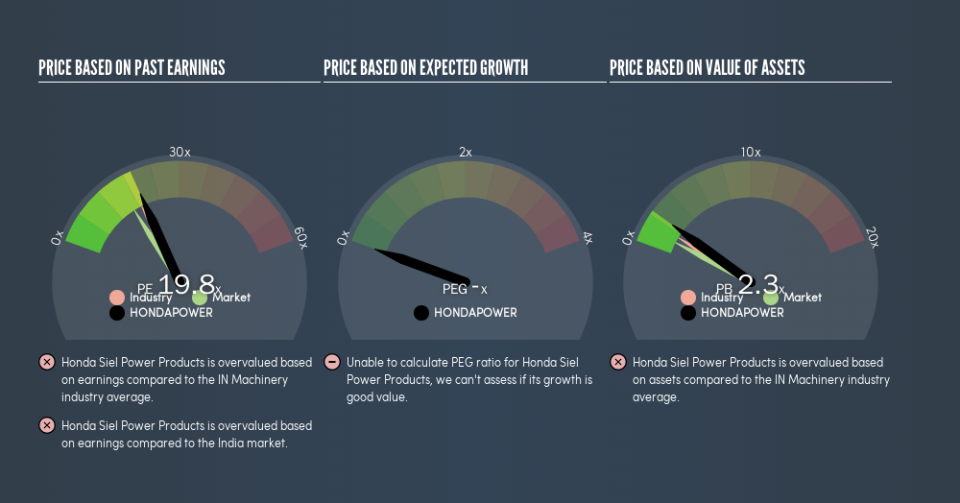
Honda Siel Power Products trades on a P/E ratio of 19.8, which is above the IN market average of 16.2. The recent drop in earnings per share might keep value investors away, but the net cash position means the company has time to improve: and the high P/E suggests the market thinks it will.
Investors should be looking to buy stocks that the market is wrong about. If the reality for a company is better than it expects, you can make money by buying and holding for the long term. So this free visual report on analyst forecasts could hold the key to an excellent investment decision.
You might be able to find a better buy than Honda Siel Power Products. If you want a selection of possible winners, check out this free list of interesting companies that trade on a P/E below 20 (but have proven they can grow earnings).
We aim to bring you long-term focused research analysis driven by fundamental data. Note that our analysis may not factor in the latest price-sensitive company announcements or qualitative material.
If you spot an error that warrants correction, please contact the editor at editorial-team@simplywallst.com. This article by Simply Wall St is general in nature. It does not constitute a recommendation to buy or sell any stock, and does not take account of your objectives, or your financial situation. Simply Wall St has no position in the stocks mentioned. Thank you for reading.
